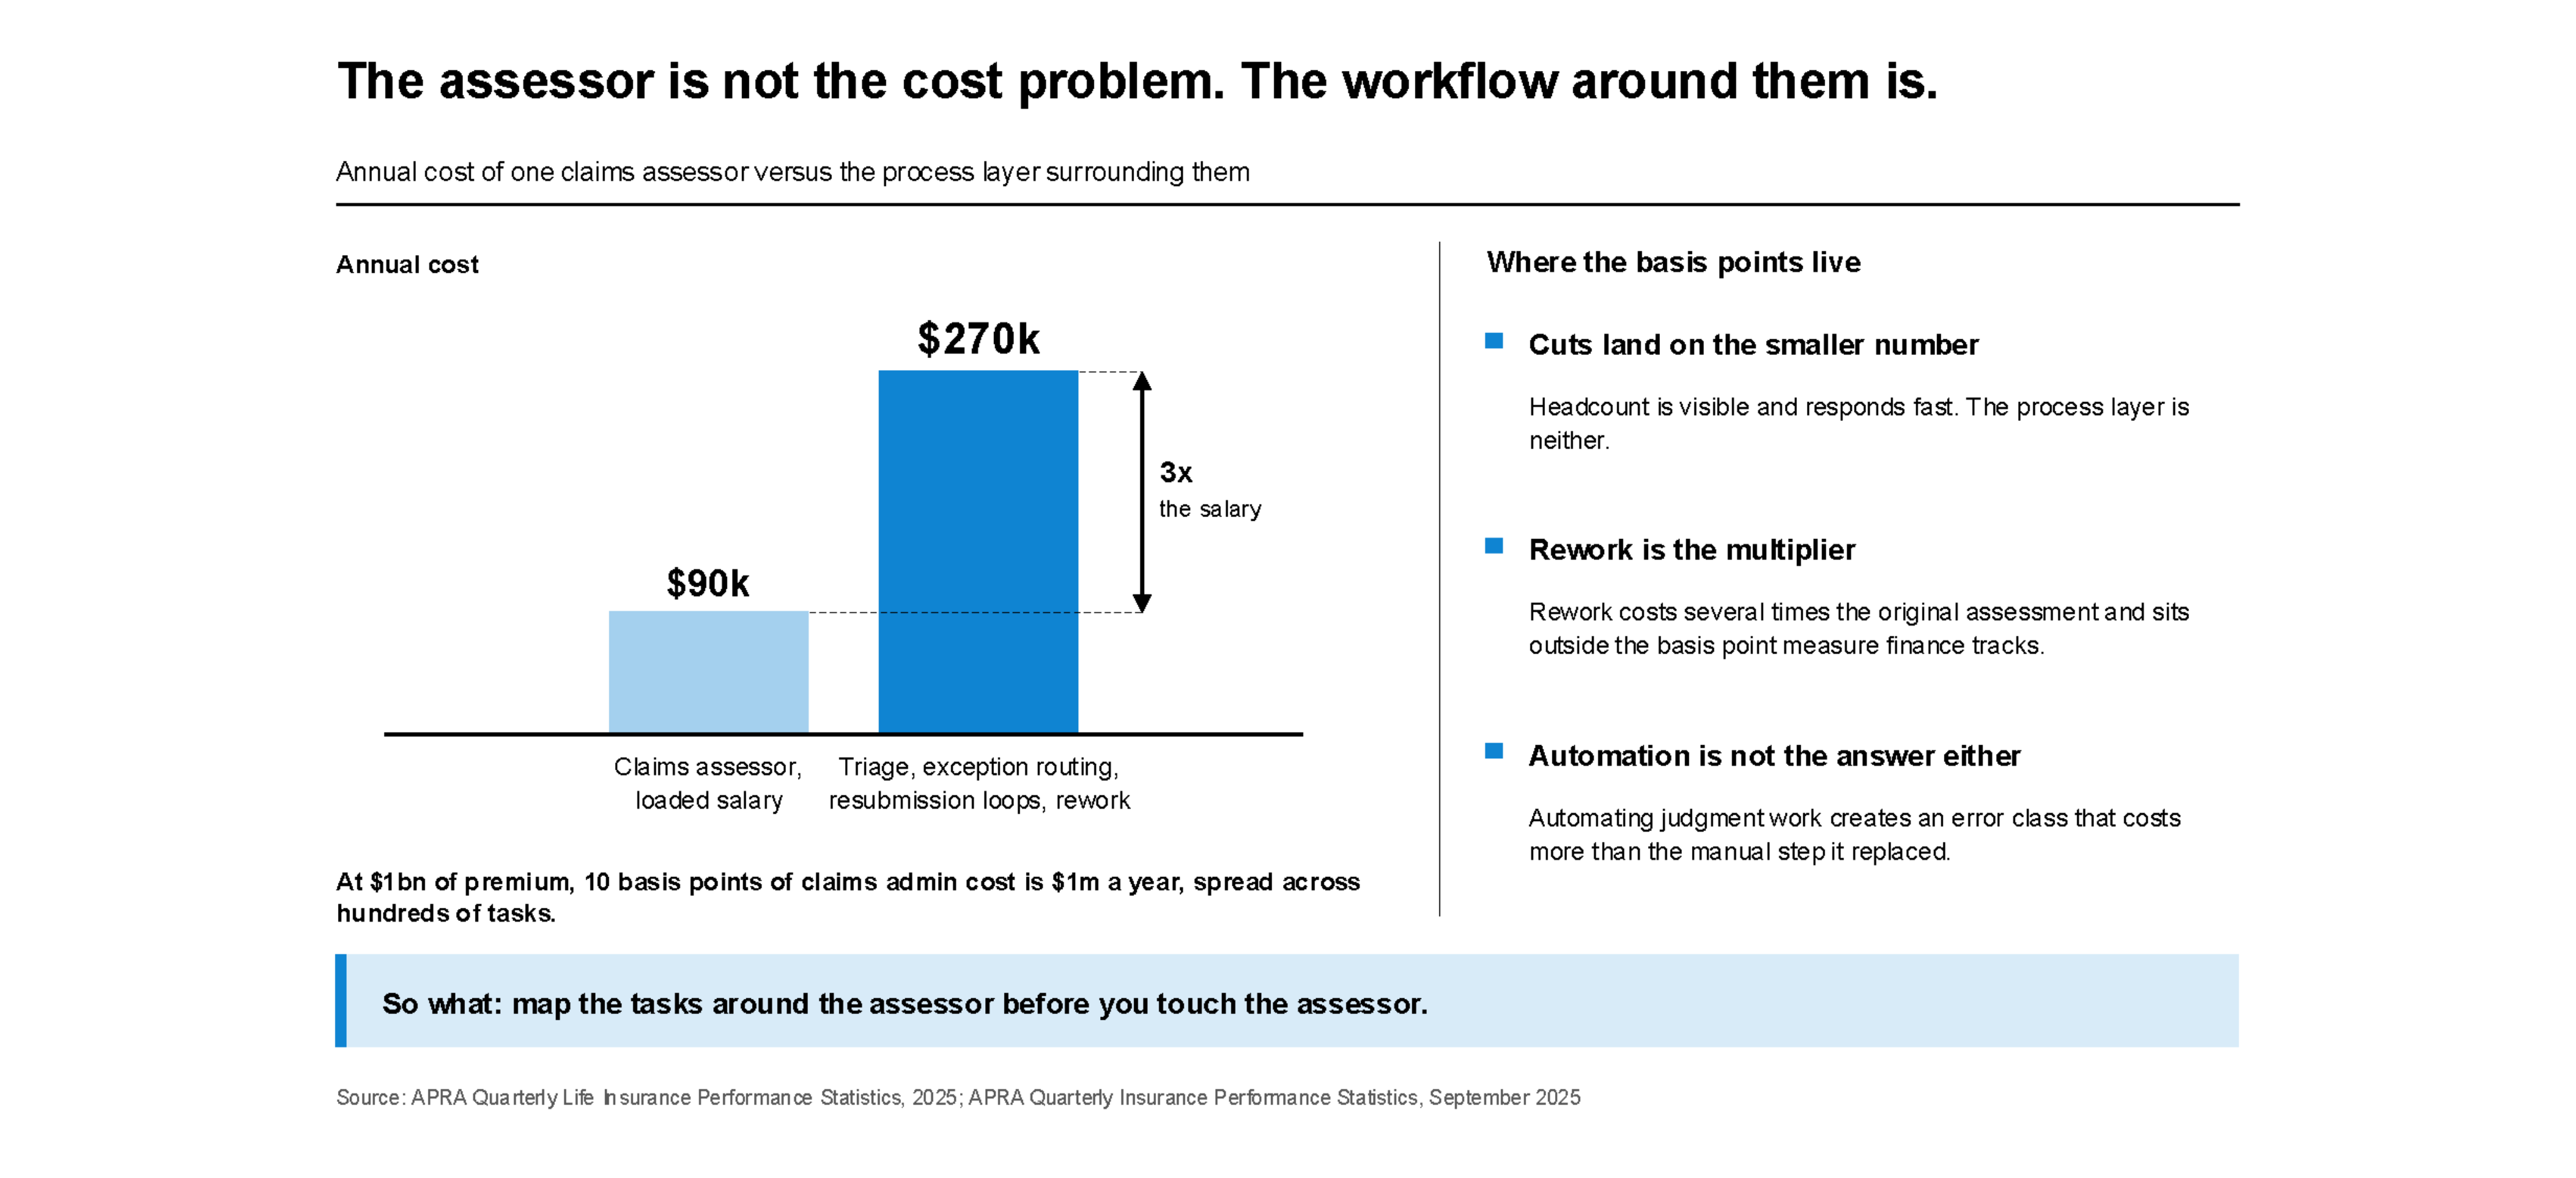


The claims assessor costs $90,000 per year. The process around them - the triage queue, the exception routing, the incomplete submission loop, the rework cycle - can cost three times that. The assessor is not the cost problem. The workflow architecture is.
At a carrier with $1 billion in annual premium, 10 basis points of claims admin cost is $1 million per year. Twenty basis points is $2 million. Neither number appears on its own reporting line. Both sit inside the aggregate expense ratio, waiting to be found.
APRA data shows insurance service expenses rose 7% year-on-year across Australia to September 2025. That rise is not concentrated in a single line item. It is distributed across hundreds of tasks in the claims workflow, each accumulating small inefficiencies that report as a single composite number at book level. The question is where the basis points live - and the answer is almost never where the first instinct points.
The common response to a rising claims expense ratio is a headcount conversation. Reduce the team, reduce the cost. Those cuts show up in the next reporting cycle. The cost that does not respond lives in the process layer around the assessors.
That layer has specific locations: the triage queue that routes manually when automated filtering would cost a fraction; the incomplete submission loop that sends a case back once or twice before assessment can begin; the exception queue accumulating cases no workflow rule was designed to handle. Each step adds handling time. None appear as a named line in the basis-point report.
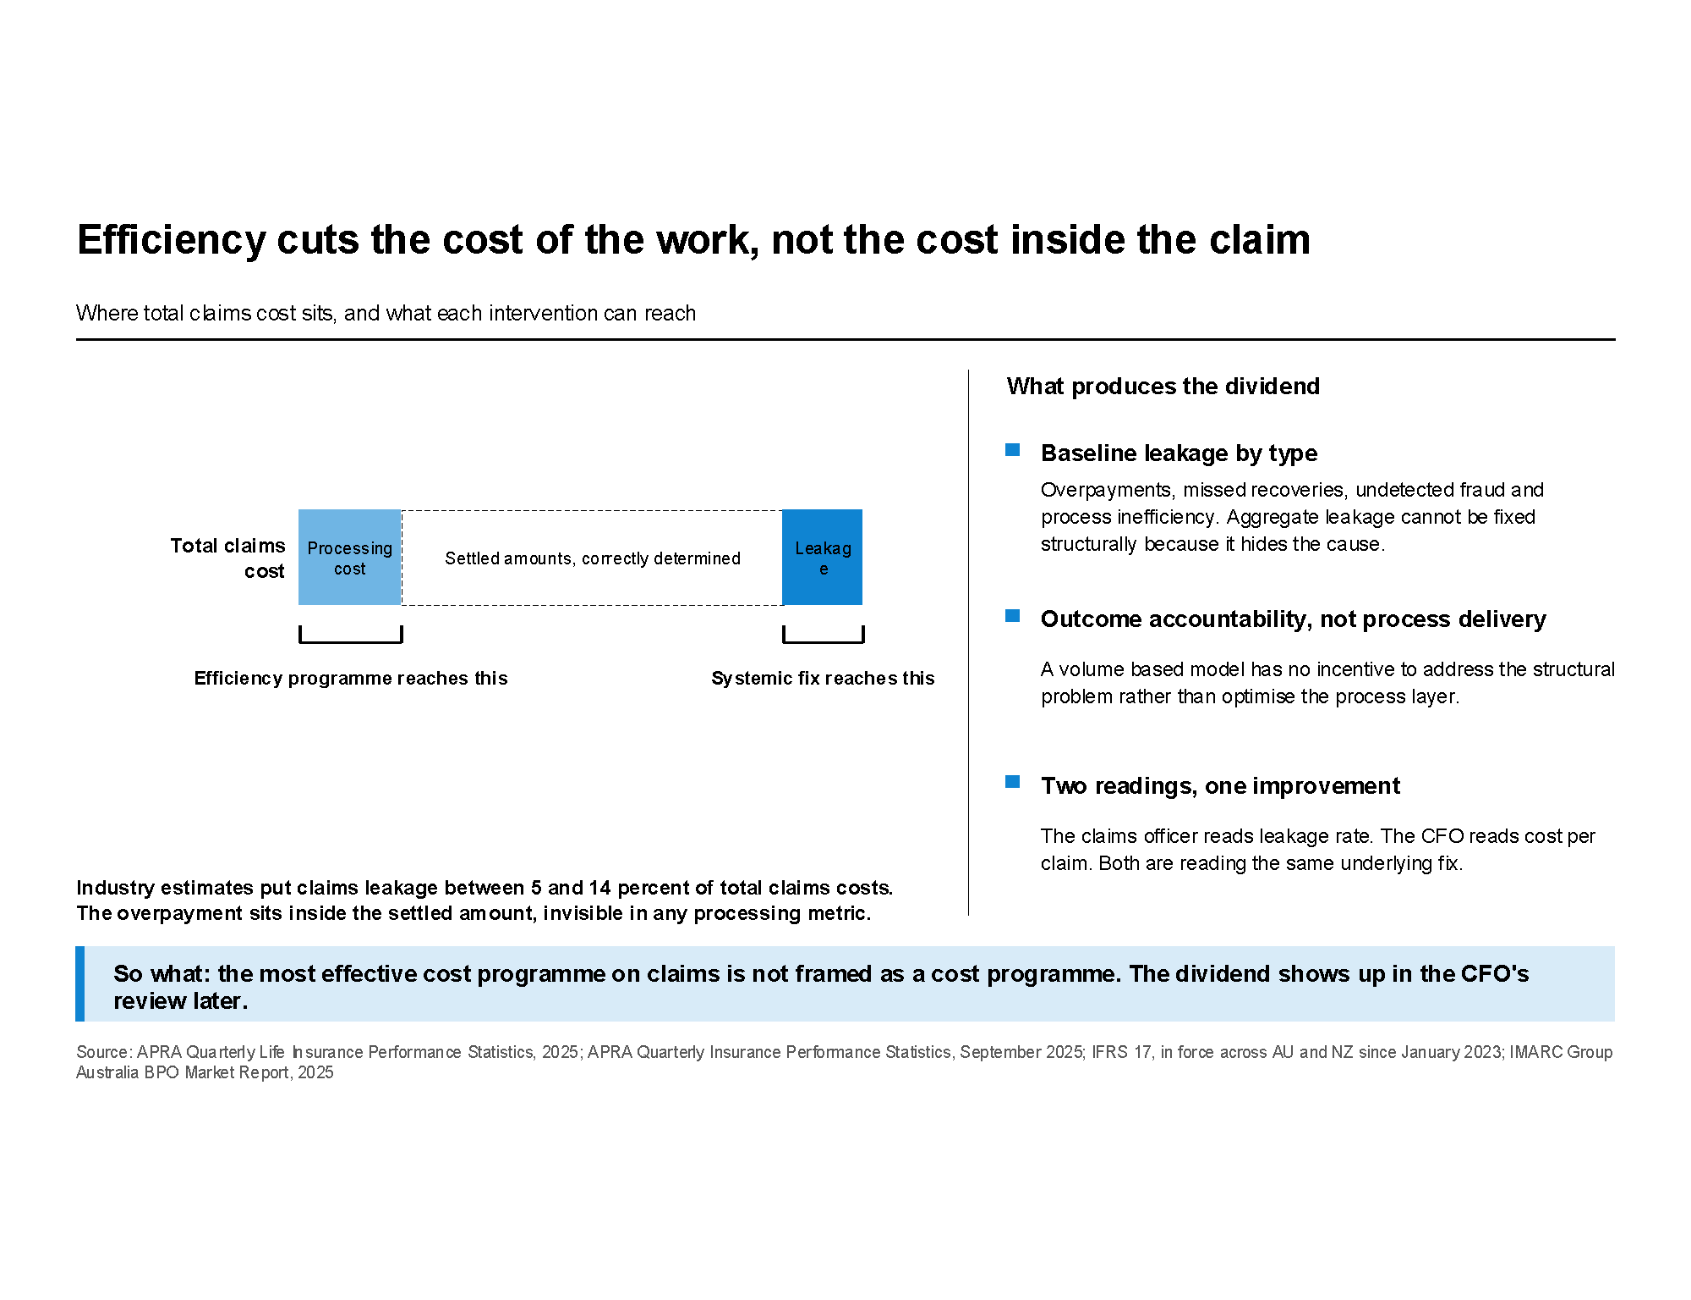
The rework dimension compounds this. Industry experience shows rework typically costs several times the original assessment - and rework almost never appears in the basis-point measure your finance team is tracking. The cost is there. The reporting is not capturing it at the level needed to explain the variance.
Post-merger carriers running multiple admin stacks carry additional exposure. When two legacy environments manage claims from the same book, the handoff points generate exception volumes a single-environment operation would not see.
The instinct in claims ops is to treat automation as the cost reduction answer. Automate what can be automated; leave a person on the rest. This binary produces predictable failures.
Automation applied to judgment-required work does not reduce cost. It creates a new error category: the claim that settled incorrectly because the automation missed an ambiguous documentation pattern; the escalation that did not happen because the routing rule had no exception path. Resolving those errors costs more than manual assessment would have.
The right model is sequenced, not binary. Map the claims workflow tasks by judgment requirement and error-sensitivity. Route low-judgment, high-volume tasks - status notifications, straightforward document ingestion, simple triage decisions - to automation. Keep skilled assessors on the work where their judgment reduces rework: complex medical assessments, disputed liability, regulatory correspondence. The unit cost drops when the task allocation matches the actual cost driver, not when automation coverage is maximised.
The cost reduction that moves the basis-point measure follows a specific sequence.
First: task-level process mapping on the live claims system. Not a future-state model - a map of what is actually happening, with exception clusters, rework rates, and incomplete submission loops documented at task level on the actual platform.
Second: automation scoped to tasks where it genuinely reduces cost without degrading accuracy. The scope is defined by what does not require judgment, not by what a tool can technically process.
Third: skilled assessors repositioned to the work that justifies their cost - complex claims, escalation decisions, correspondence requiring regulatory precision.
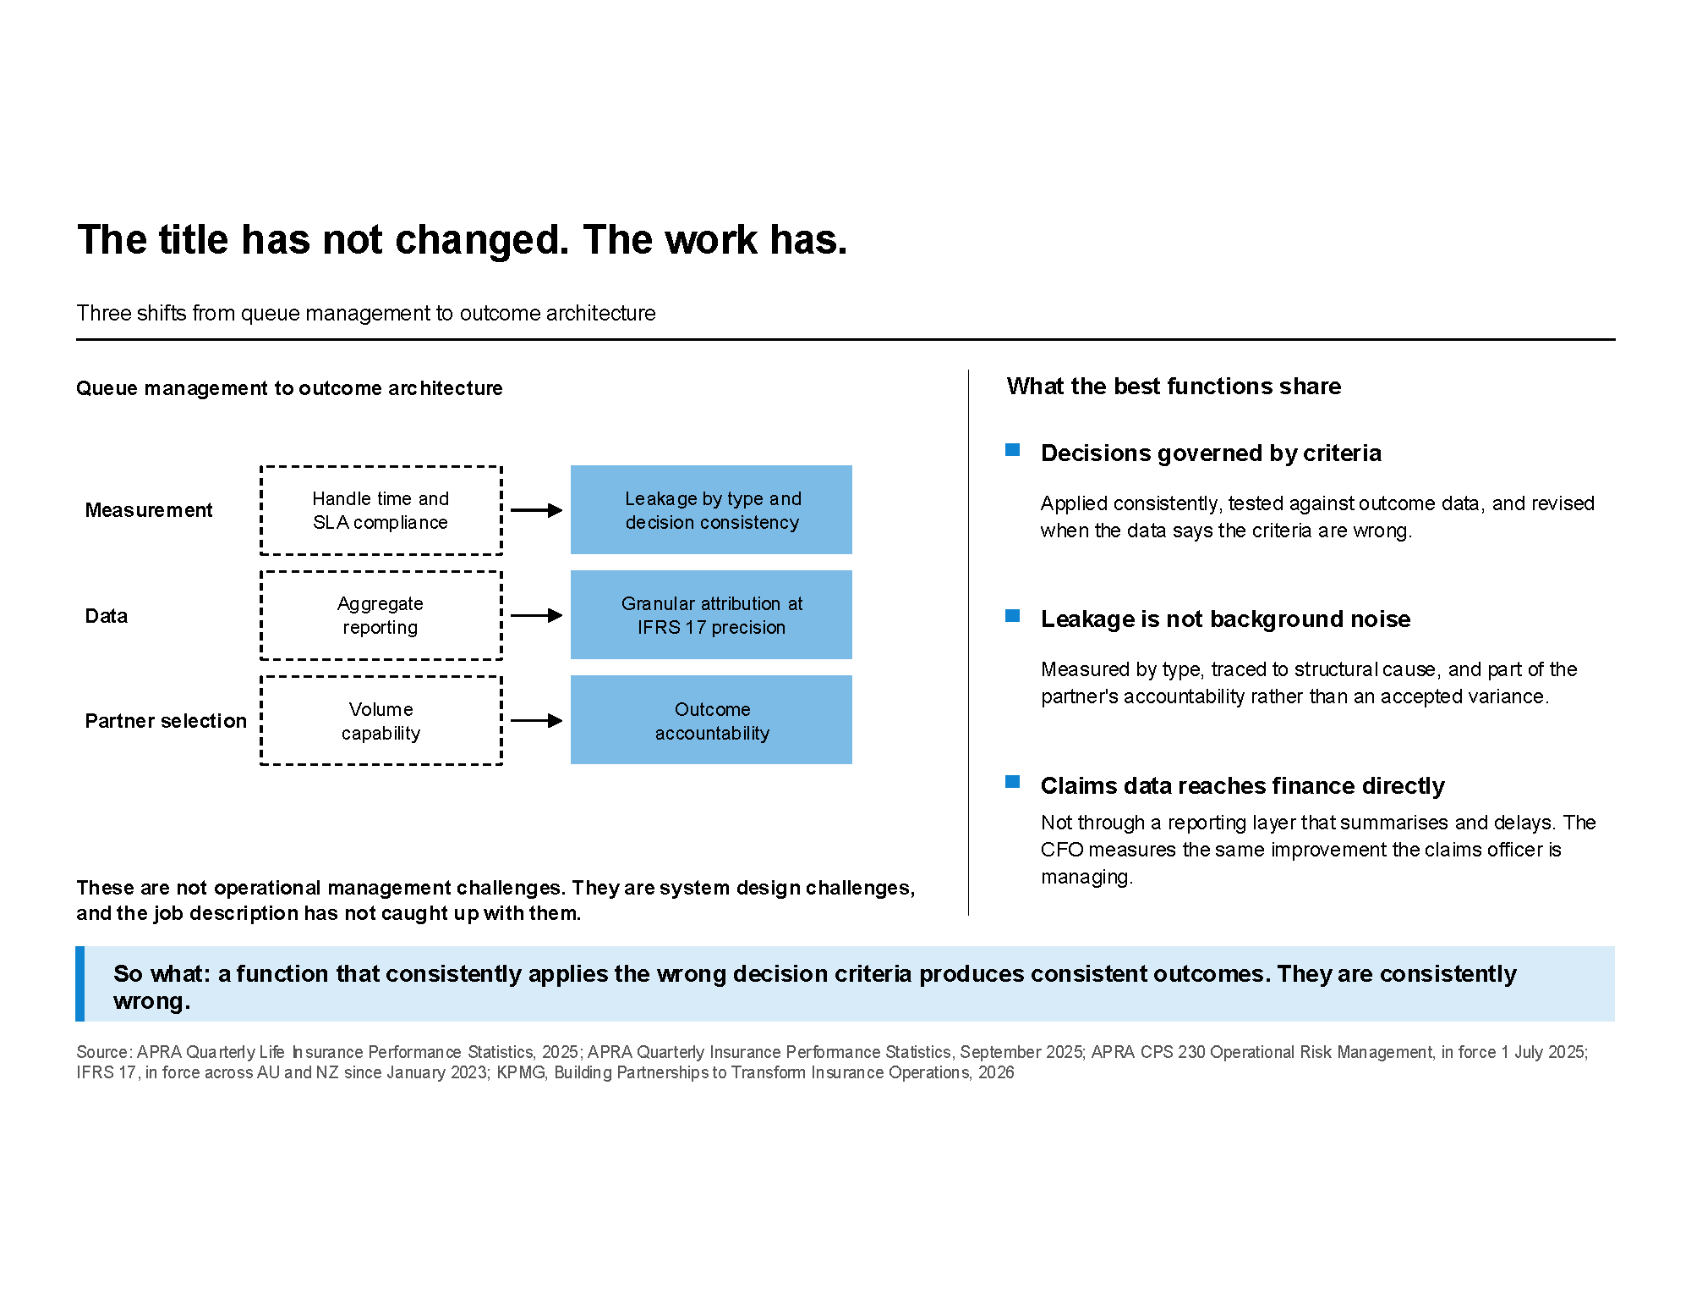
Fourth: a measured before-and-after on a defined subset of the book. Not a projected saving. A cost-per-transaction on the live system before any intervention, then the same measure after. That number survives a finance review. For carriers operating under IFRS 17, the task-level cost data a structured diagnostic produces is also the granular input that reporting precision requires.
The cost anatomy begins with task-level measurement on the live system - no migration required, no lengthy onboarding runway.
If the basis-point question is live in your claims operation, it is worth thirty minutes to discuss what task-level measurement on your existing system could show.
Sources: APRA Quarterly Life Insurance Performance Statistics (2025); APRA Quarterly Insurance Performance Statistics (September 2025); IMARC Group Australia BPO Market Report (2025)