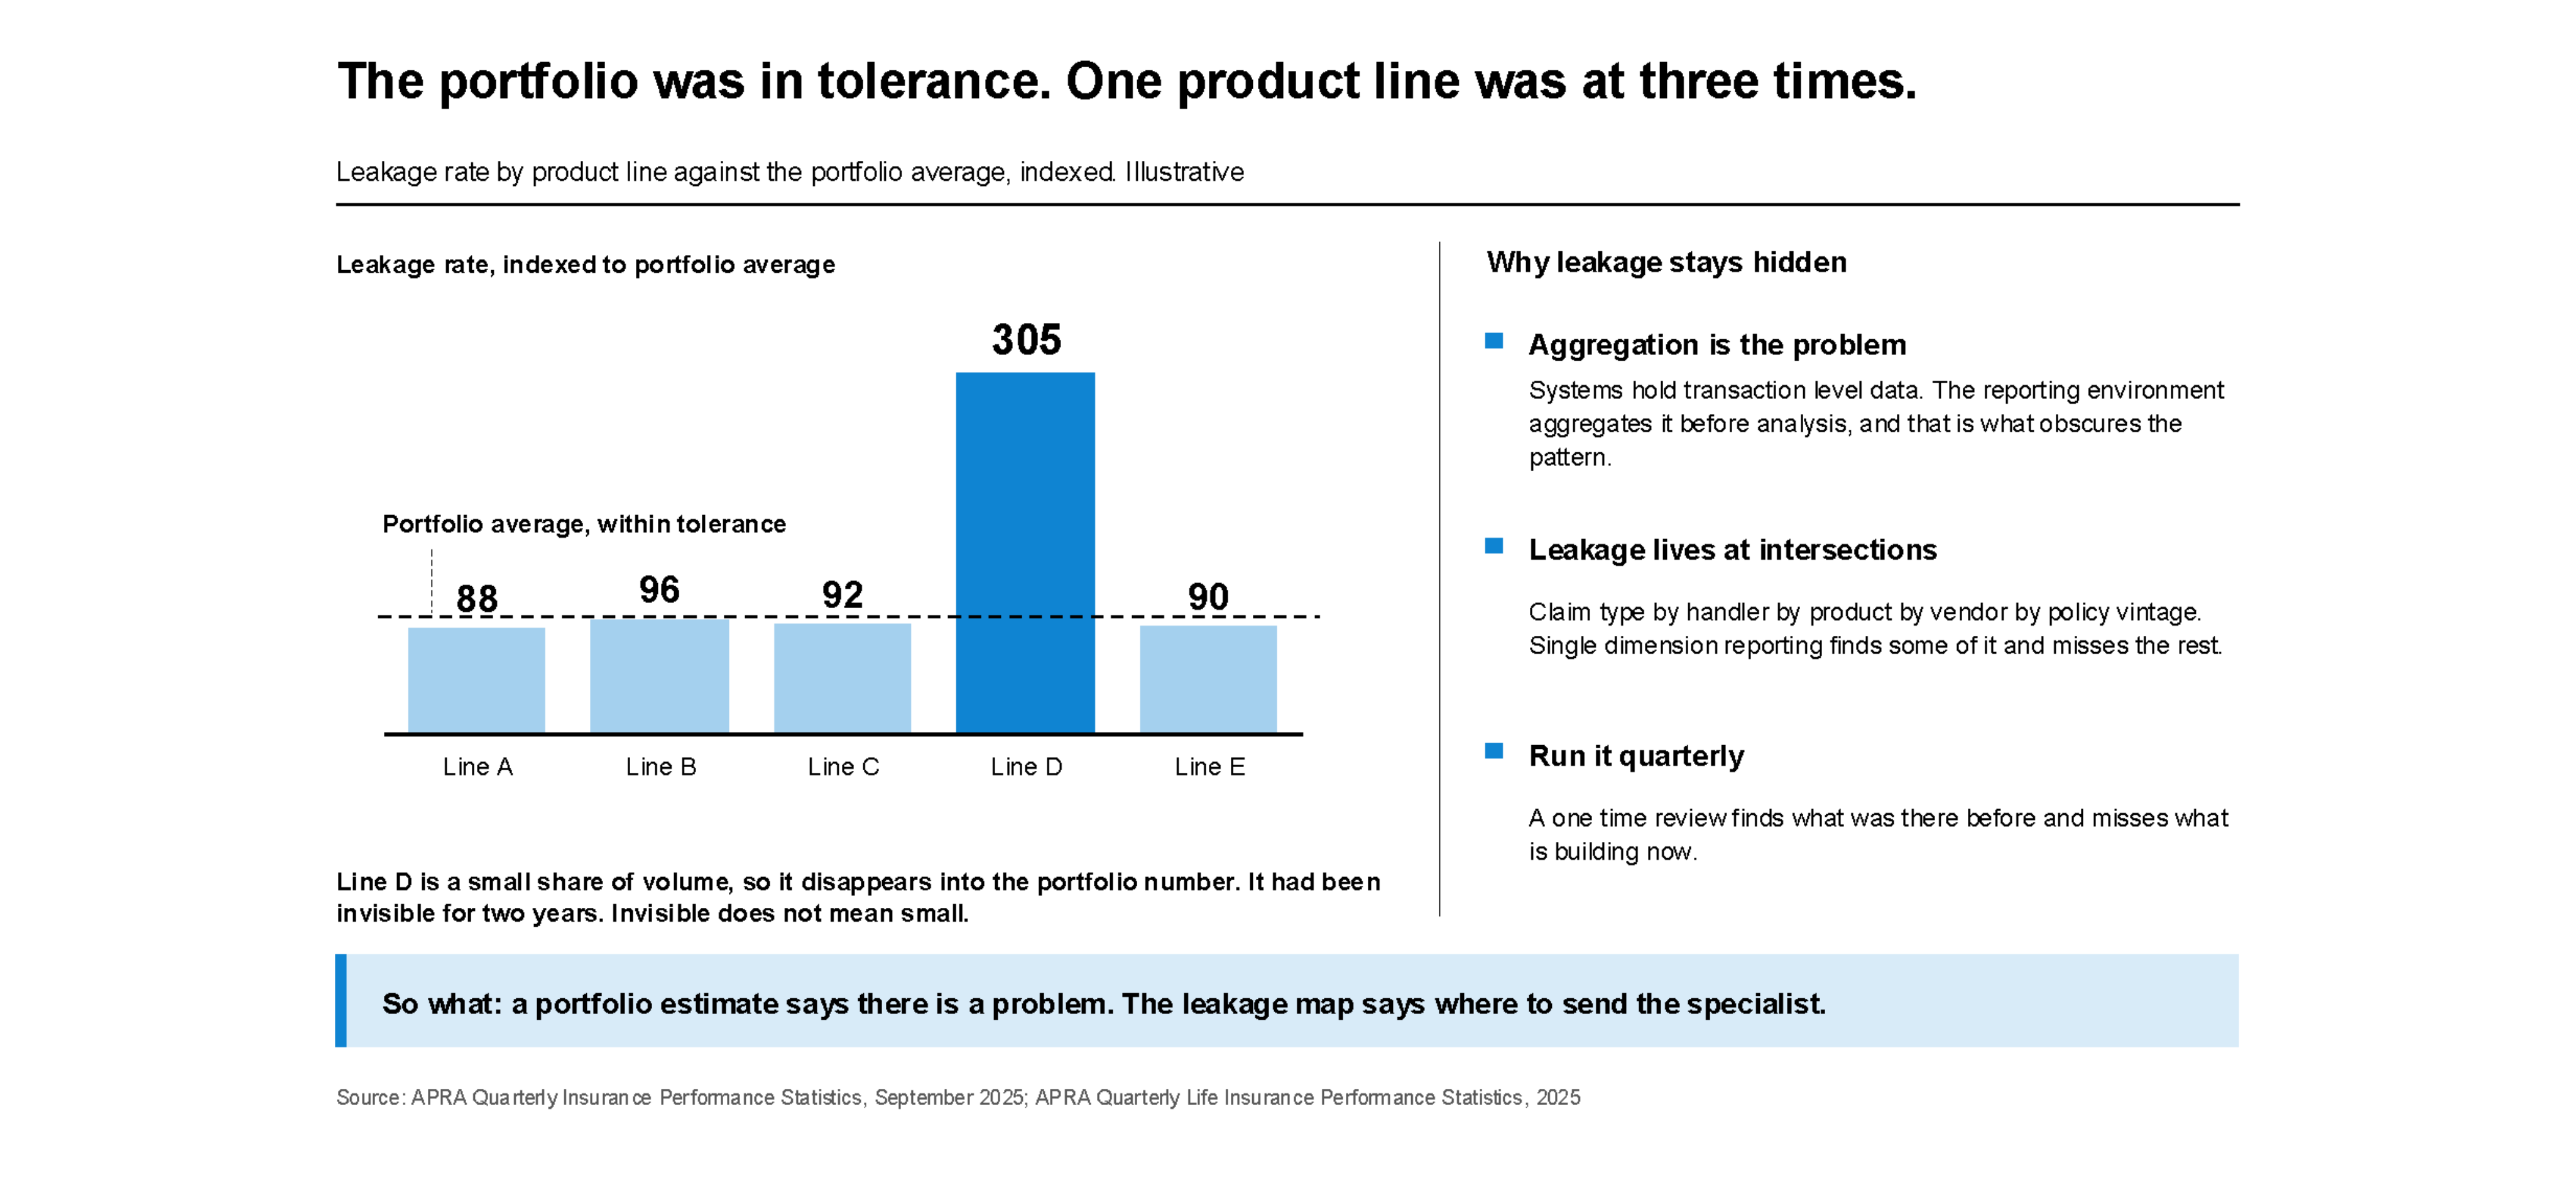


The portfolio review showed everything within tolerance. Expense ratios were acceptable. Claim frequency was tracking to model. The loss ratio was inside the corridor. Then someone ran the same data by product line rather than by portfolio. One product had a leakage rate three times the average. It had been invisible for two years.
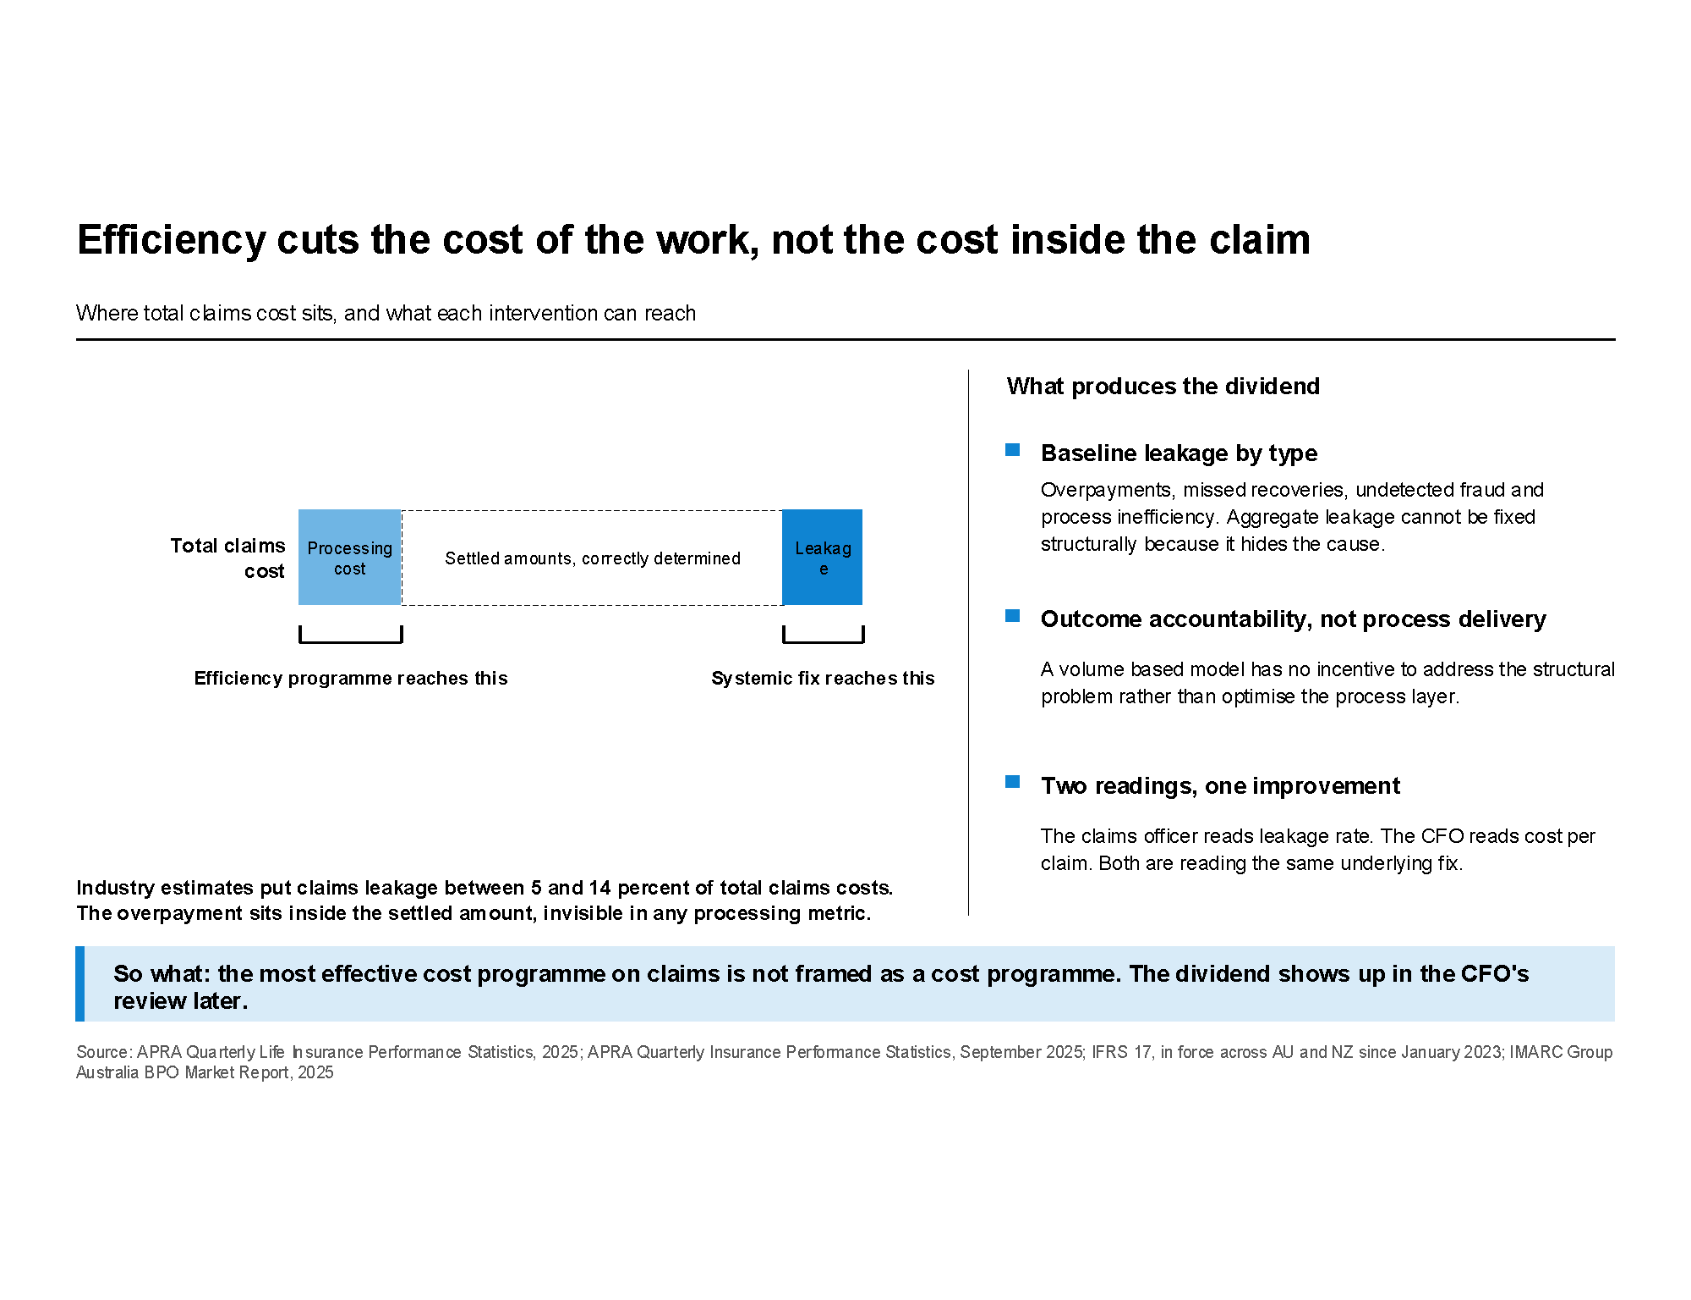
Most claims operations report at portfolio level: overall loss ratio, average cost per claim, total expense ratio. Those numbers satisfy board and regulatory reporting requirements. They do not find leakage.
Leakage hides in the detail. It is the product line where a specific claim type is being settled above the defensible range. The handler cohort where documentation gaps lead to payments that could have been challenged. The geographic cluster where vendor invoices consistently exceed market rate. The policy vintage where a coverage ambiguity is being resolved one way without systematic review.
None of those patterns surface at portfolio level. They require transaction-level data integration and analytics across the dimensions where leakage actually concentrates.
The structural reason leakage persists is that claims data is not typically integrated at the level of granularity required to find it.
Claims management systems hold transaction-level data. But the reporting environment almost always aggregates that data before analysis. The aggregation that makes the data manageable is the same aggregation that obscures the pattern.
The leakage patterns that matter live at the intersection of multiple dimensions: claim type, handler, product, vendor, policy vintage, geography, coverage category. Running analytics across a single dimension surfaces some of the problem. Running analytics across combinations of dimensions finds the leakage that single-dimension analysis misses.
The point can be illustrated by industry practice: carriers that have integrated transaction-level claims data and run multi-dimensional leakage analytics typically find that leakage reduction materialises in the first operating year. The leakage was not new. The visibility was.
The concept of a leakage map is specific. It is not a report on total leakage. It is a per-line, per-handler, per-product, per-vendor view of where value is exiting the claims operation, and why.
A leakage map built from transaction-level data integration is a different instrument from the aggregate reporting that most claims leadership teams currently use. It identifies specific conditions - a product line, a claim type, a handler cohort, a vendor arrangement - where the leakage is concentrated, and it quantifies the financial exposure associated with each.
That specificity matters because it determines the intervention. A portfolio-level leakage estimate tells the Chief Claims Officer that there is a problem. The leakage map tells them where to send the specialist.
The leakage that is hardest to find at aggregate level is typically the leakage that has been present longest. Invisible does not mean small.
The data and analytical work required to build a leakage map follows a clear sequence.
First: data integration at transaction level. Claims data from the management system, vendor invoice records, handler decision logs, and customer communication records need to be integrated into a single analytical environment at transaction level. Summary data cannot be dis-aggregated after the fact. The transaction-level extract is the prerequisite.
Second: multi-dimensional analytics across the dimensions that matter - claim type, handler, product, vendor, geography, coverage category. Single-dimension reporting surfaces some patterns. Multi-dimensional analysis finds the combinations that have been invisible for two years.
Third: the leakage map as a repeating instrument, not a one-time review. The patterns shift as the book changes - new products, new vendors, new handler cohorts. A map that runs quarterly identifies emerging patterns before they compound. A one-time review finds what was there before and misses what is building now.
The leakage map is not a claims report. It is a strategic tool for the Chief Claims Officer - one that locates the decision points where intervention generates the highest financial return.
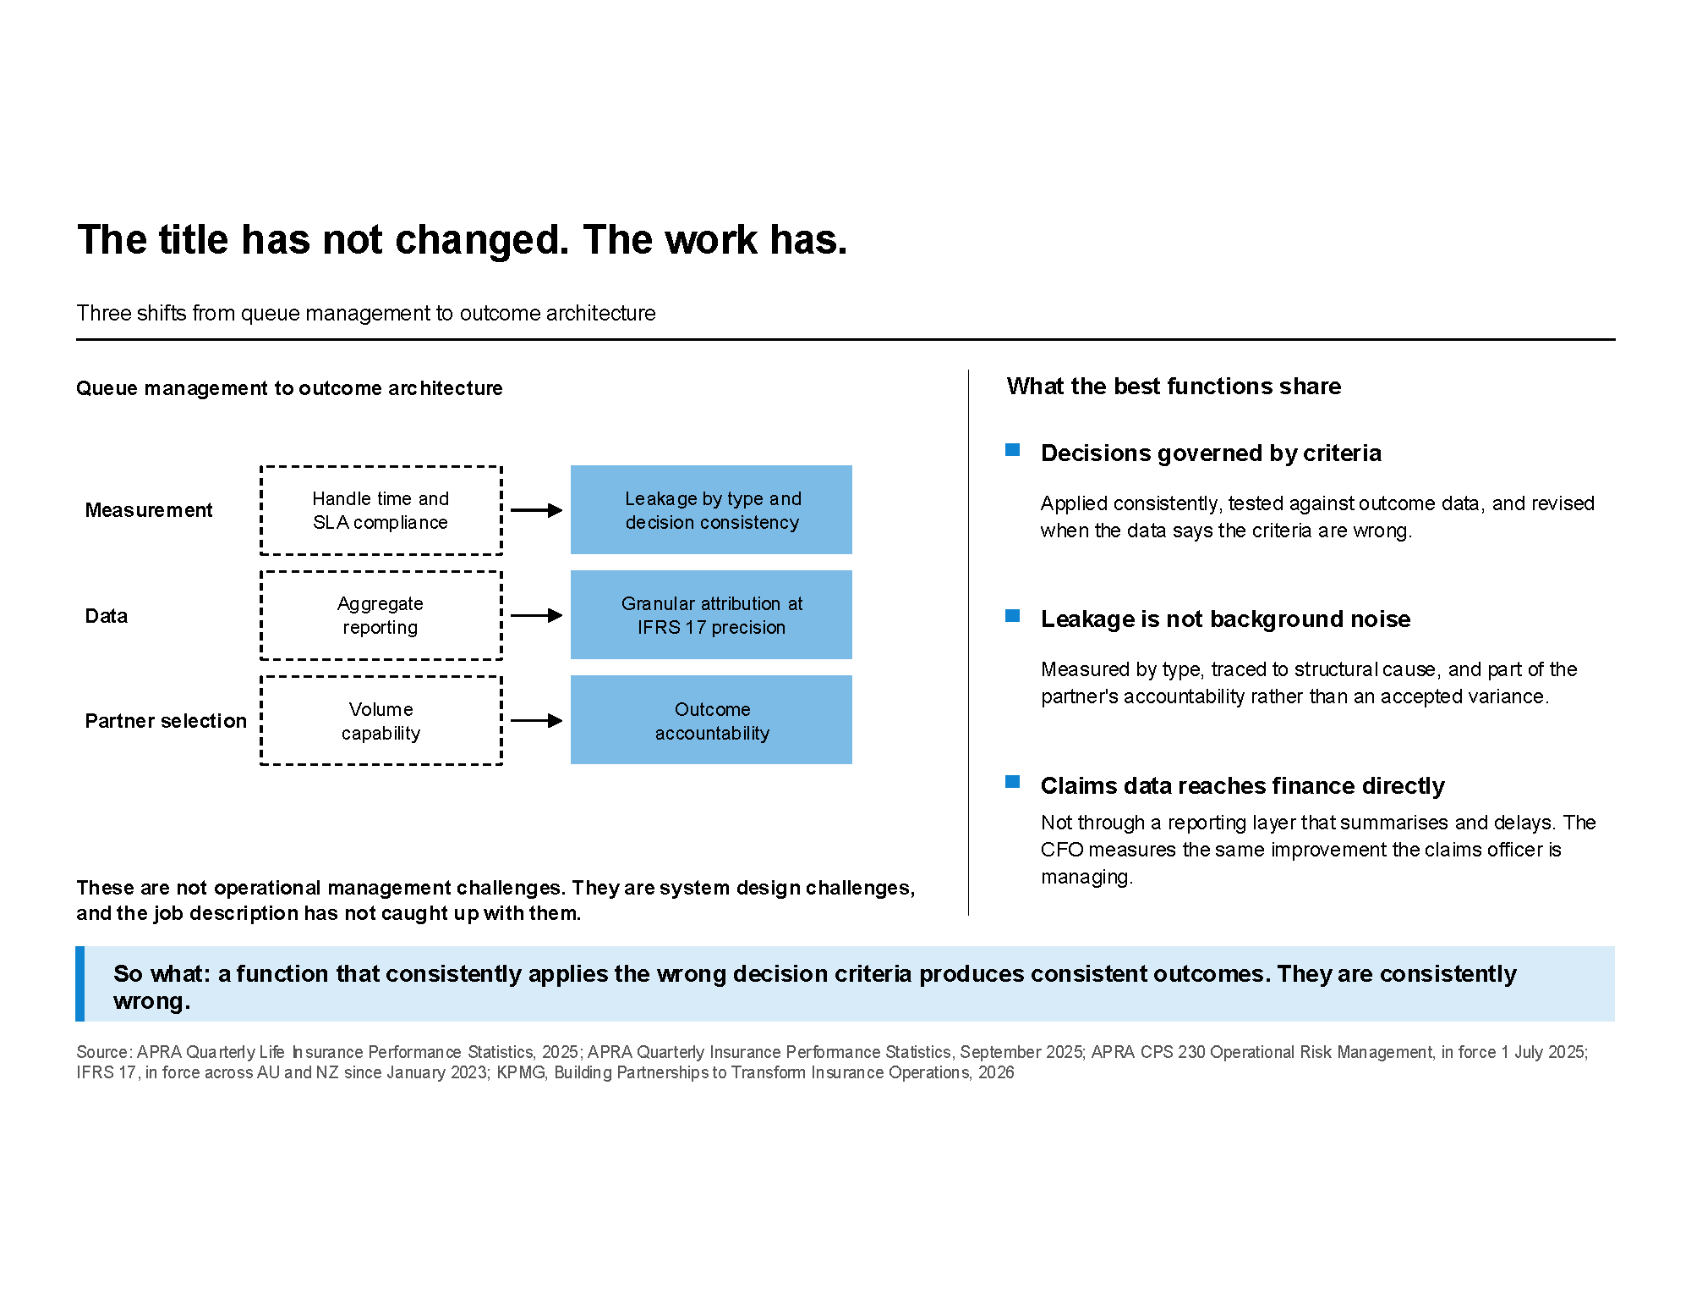
ISSI's partnership model is structured around co-owning claims and fraud outcomes - not staffing a queue. With experience on claims-intensive platforms including PetSure's GapOnly real-time claims environment, ISSI works on an outcome-based commercial model rather than a staff-augmentation arrangement. If claims leakage visibility, transaction-level data integration, or the analytics required to build a leakage map are live questions, it is worth thirty minutes.
Sources: APRA Quarterly Insurance Performance Statistics (September 2025); APRA Quarterly Life Insurance Performance Statistics (2025)