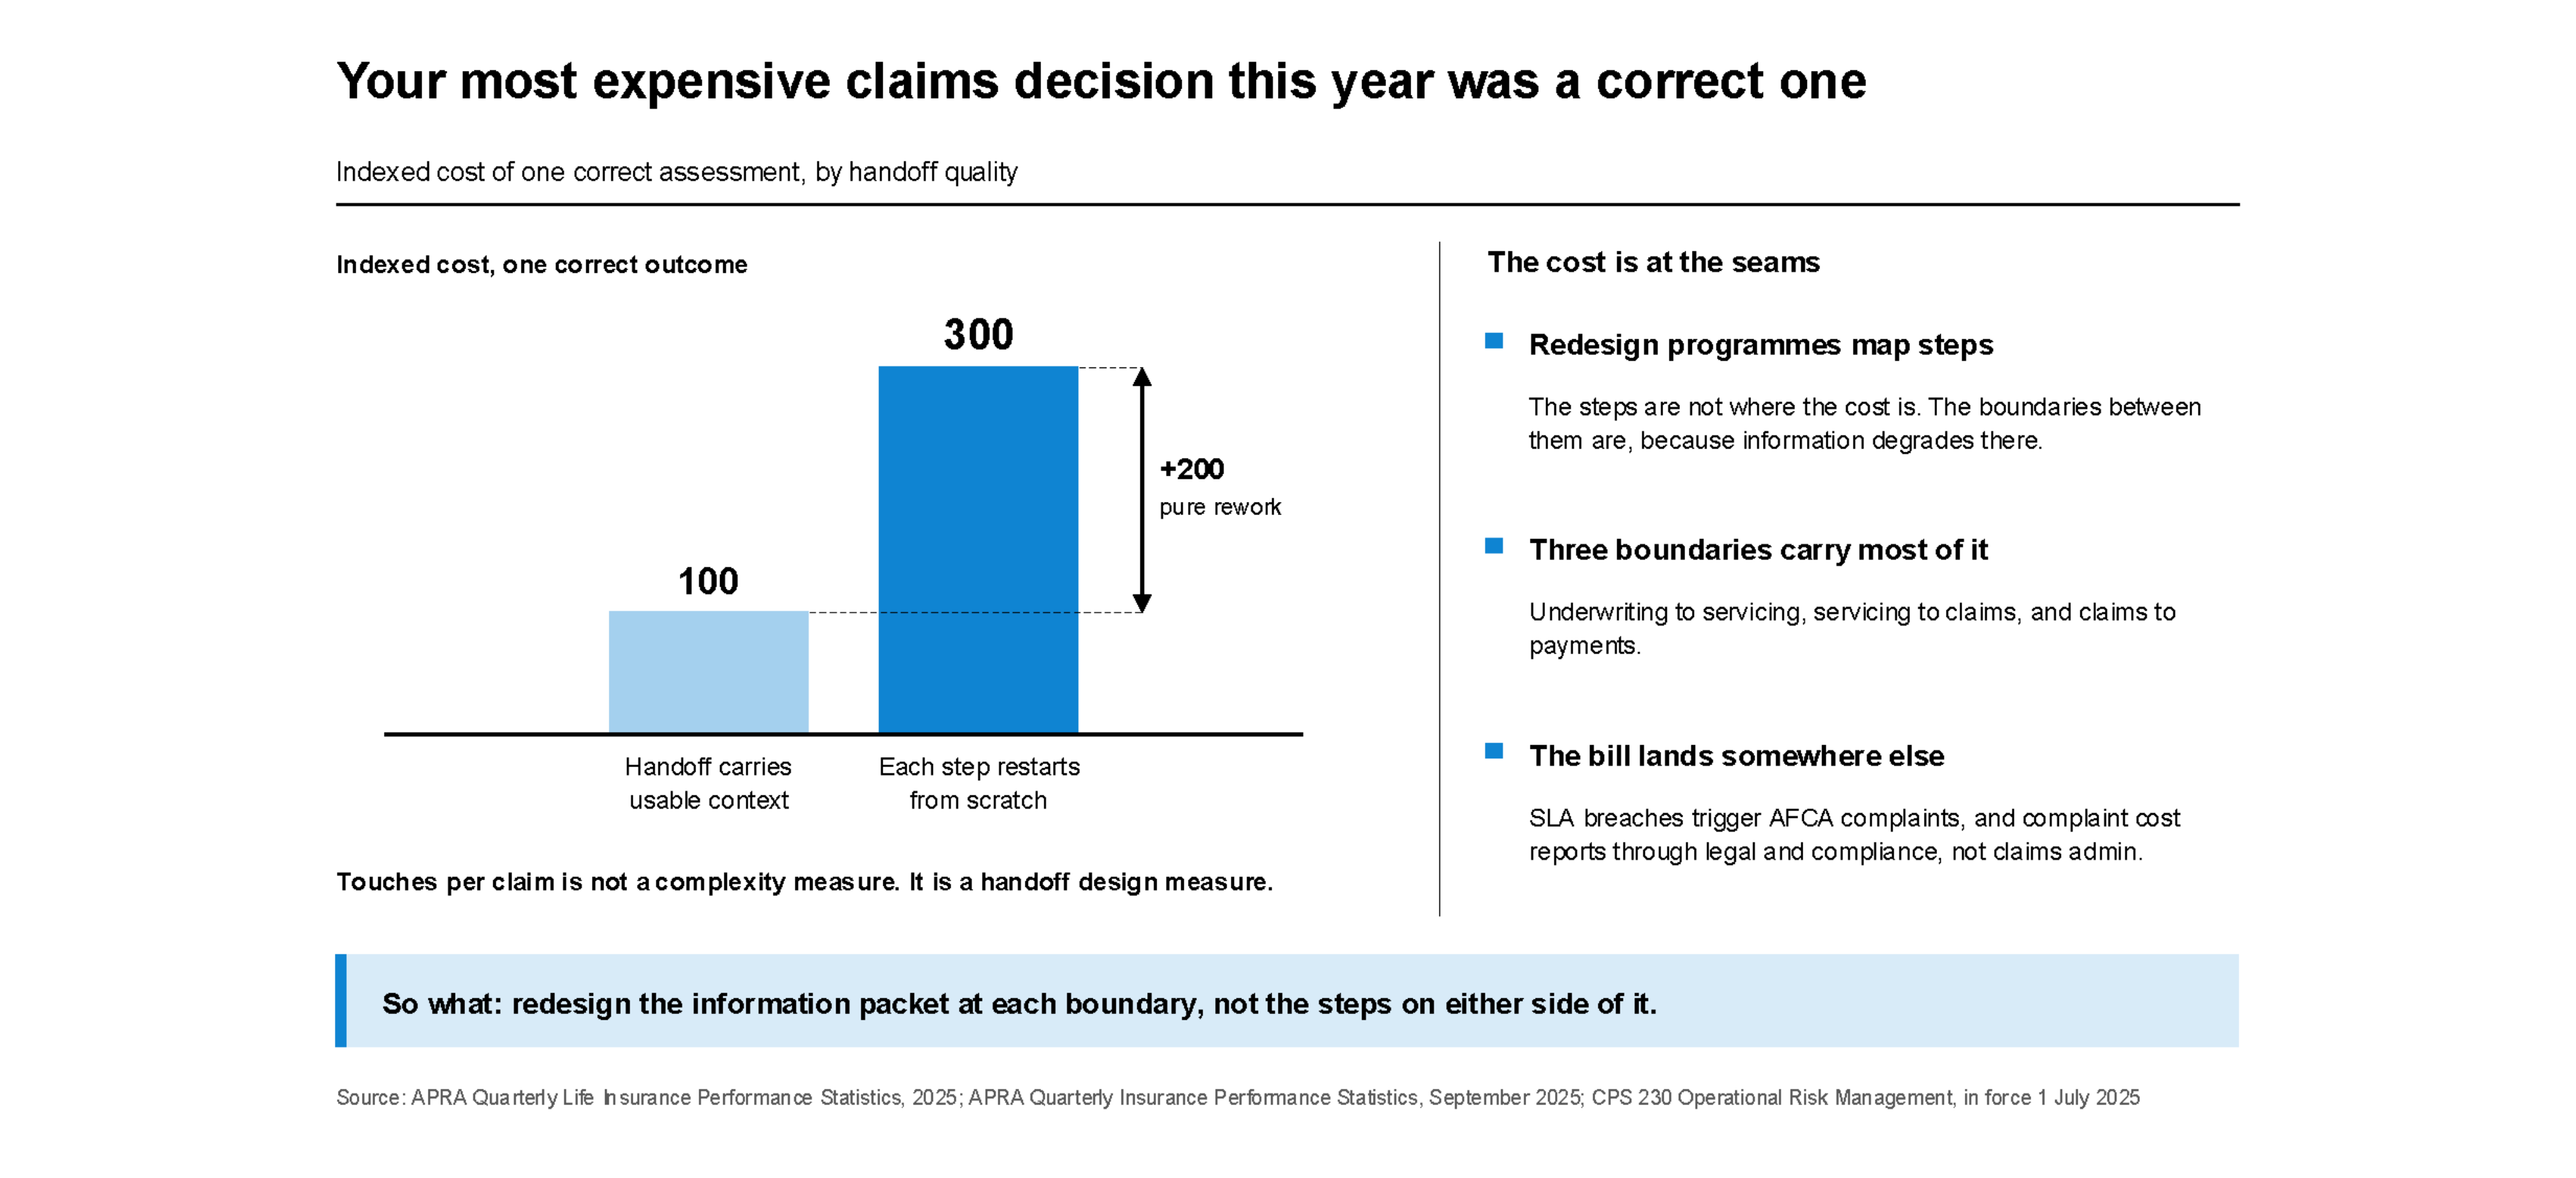


The most expensive claims decision your operation produces today is probably a correct one. Not because the assessment was wrong, but because it was made three times - each time starting from scratch because the handoff from the previous step carried no usable context.
Insurance service expenses rose 7% year-on-year at industry level through September 2025. Headcount has been reduced. Automation has been deployed. The cost line has not moved as expected.
The cost that does not respond to those programs lives at the boundaries between steps. Claims operations track "touches per claim" as a process KPI. A high touch count is not a complexity indicator. It is a handoff design indicator: the file is bouncing between steps because each step cannot complete its work on the information the previous step transferred.
One bad handoff does not generate one cost. It generates a cascade.
Information is lost or degraded at the boundary - wrong format, missing context, an incomplete file. The receiving step restarts. The restart takes time the original workflow did not budget. A delay accumulates. At some point, the SLA is breached.
In claims handling, SLA breaches are AFCA complaint triggers in Australia; equivalent conduct complaint exposure exists under NZ regulatory governance. Complaint handling costs are not in the claims admin expense line. They are distributed across legal, compliance, and customer service reporting. The full cost of the original handoff failure never appears as a single number.
The cost is in the number of times it was done, not in what was decided.
Most process redesign programs map the steps. The steps are not where the cost lives.
The boundary from underwriting to servicing carries information that served the underwriter's decision but not the context the servicing team needs forward: the conditions that affect claims eligibility, the exceptions that are in the file but not structured for downstream consumption.
The boundary from servicing to claims is where tracing gaps accumulate. Employer changes in group life not updated in the servicing record, beneficiary amendments that did not propagate - the claims assessor begins from an incomplete file and the rework is structural.
The boundary from claims to payments is the second error opportunity in every claim. Claims approval and payment execution are separate events in most legacy environments. Manual re-entry of payment instructions between systems is where disbursement errors originate.
Seam redesign works in three steps and on the existing system.
Step one: map the handoff, not the process. For each boundary, identify what information the receiving step needs to begin without restarting versus what is currently transferred, in what format, with what completeness.
Step two: quantify the gap. Rework rate attributable to each handoff, SLA breach frequency at that boundary, complaint rate traceable to that seam. The gap between what is needed and what is transferred is the cost source, measurable from existing operational data.
Step three: redesign the information packet. Defined required fields, standardised format consumable by the receiving system, automated trigger that fires only when the packet is complete. The redesign operates within the existing platform - no new integration project required.
Under CPS 230, in force from 1 July 2025, documented process controls at critical operation boundaries are operational risk management evidence. The seam analysis produces that documentation as a by-product.
Cross-workflow experience means both sides of each seam are within the operating footprint.
If the rework report and the SLA breach report are pointing at the same handoffs, it is worth thirty minutes to discuss what seam redesign looks like on your operation.
Sources: APRA Quarterly Life Insurance Performance Statistics (2025); APRA Quarterly Insurance Performance Statistics (September 2025); IMARC Group Australia BPO Market Report (2025)