

The vendor has just presented their benchmark study. The savings look compelling. The methodology is in the appendix, and the appendix references a proprietary dataset. You have no way to verify whether the operations in that dataset look anything like yours.
The cost pressure is genuine. Other insurance expenses as a proportion of premium across Australian life insurance rose from 15% to 18% in the twelve months to June 2025. Insurance service expenses grew 7% year-on-year at industry level through September 2025. CFOs need an answer.
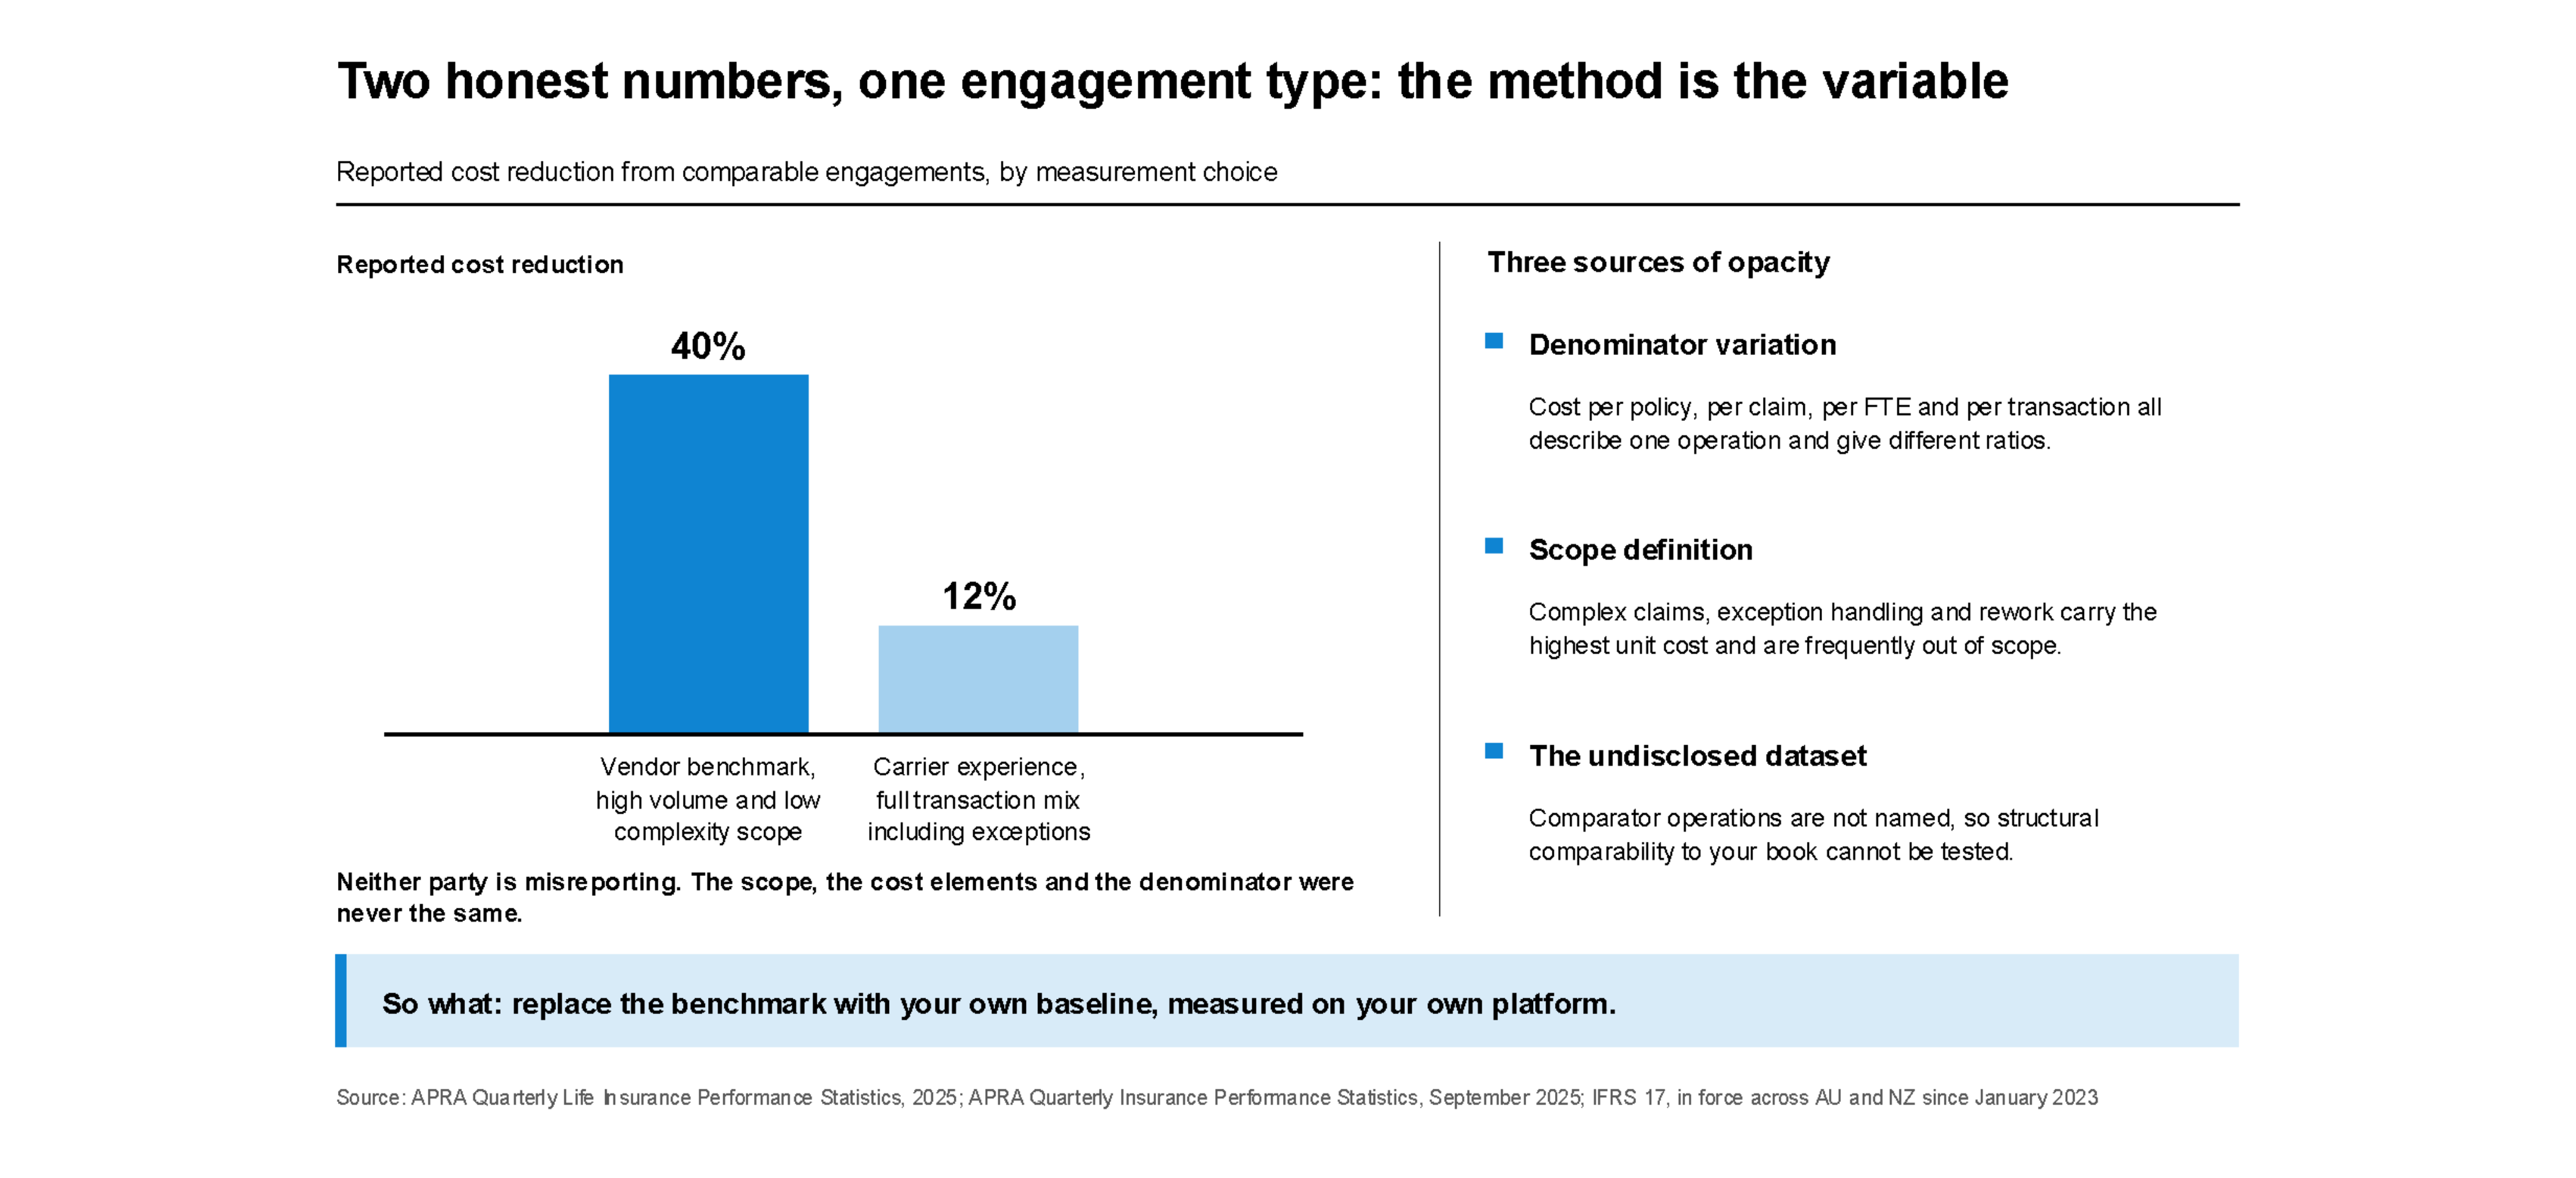
The problem is not that vendors fabricate savings. A benchmark showing 40% cost reduction and a carrier that experienced 12% from the same engagement type can both be reporting accurately. The operations it measured, the transactions it counted, and the cost elements it excluded are not in the footnotes. They are the answer.
The benchmark becomes unverifiable through three consistent mechanisms.
The first is denominator variation. Cost-per-policy, cost-per-claim, cost-per-FTE, and cost-per-transaction all describe the same operation. They produce materially different ratios. The vendor's benchmark uses one; your internal model uses another. The comparison is between two ways of measuring cost, not between their operation and yours.
The second is scope definition. Vendor benchmarks are typically built on high-volume, low-complexity transaction types. Complex claims, exception handling, and rework cycles - which carry the highest unit cost in most carrier operations - are frequently out of scope. The number looks good because the hard part is not in it.
The third is the proprietary dataset. The comparator operations are not named. You cannot evaluate whether they are structurally comparable to yours in terms of policy mix, system environment, or claims complexity.
Under IFRS 17, the denominator is not a preference. Cost attribution at contract group level requires the right unit of measurement. A benchmark built on the wrong denominator compounds the problem: the savings calculation is not only incomparable, it is misaligned with how costs need to be reported.
The framework for reading a cost comparison honestly requires three specific questions.
First: what transactions are in scope - and what is explicitly excluded? Any vendor who cannot name the out-of-scope items has not defined the scope.
Second: what cost elements are included? Labour cost alone produces a different ratio from a fully-loaded calculation that includes supervision, quality assurance, transition overhead, and rework. If the answer is "fully-loaded," ask what the rework rate was in the benchmark operation.
Third: what is the denominator - and is it the same one your finance team uses for internal cost attribution?
These questions require specificity, not expertise. A vendor who answers them precisely is presenting a benchmark they can defend. A vendor who cannot is presenting a number produced from operations you cannot see, against a metric your team does not use.
The comparator that eliminates all three problems comes from the carrier's own system.
Measure cost-per-transaction on the live platform, at task level, before any intervention. Apply the operational change on a defined subset of the book. Measure again. The result uses the carrier's own data as the baseline. The denominator is whatever the finance team already uses. The scope includes the actual transaction mix. There is no proprietary dataset to audit.
Under CPS 230, in force from 1 July 2025, defensible documentation of third-party arrangements requires evidence, not estimates. A measured result on the carrier's own system is that documentation. The task-level cost data this process produces is also the granular input IFRS 17 reporting precision requires.
The methodology begins with a baseline on the live system - the carrier's own cost data, before any intervention, as the comparator.
If the expense ratio question is live and the benchmark you have been given cannot be independently audited, it is worth thirty minutes to discuss what a measurement-first approach looks like on your platform.
Sources: APRA Quarterly Life Insurance Performance Statistics (2025); APRA Quarterly Insurance Performance Statistics (September 2025); IMARC Group Australia BPO Market Report (2025)