

You have been in the meeting before. The vendor presents the case study. The savings are impressive. The platform is different. The geography is different. The policy volumes are different. And when you ask "what will you prove, on our system, in the first 90 days," the answer is a timeline, a methodology, and a number that will be confirmed after the contract is signed.
The insurance BPO market does not have a shortage of cost-reduction claims. Every vendor in the category offers a version of the same number, supported by case studies from other markets, analytics models built on benchmark data, and references from engagements that cannot be verified on your specific platform.
The cost mandate is real. Other insurance expenses as a proportion of premium across Australian life insurance rose from 15% to 18% in the twelve months to June 2025. Carriers in ANZ are under genuine pressure to reduce cost-to-serve. The question is not whether cost reduction is worth pursuing. It is whether the vendor in front of you can prove they will deliver it - before you commit to scale.
CPS 230, in force from 1 July 2025, sharpens that question. Carriers now need documented, governed third-party arrangements. A vendor promise is not documentation. A measured result is.
The problem with BPO cost-reduction proposals is not that vendors are lying. It is that they are telling the truth about someone else's platform, and presenting it as evidence about yours.
A projected saving is built on benchmark data: average cost-per-transaction from comparable operations in comparable markets, adjusted for your estimated volumes and process complexity. It is an honest estimate. It is also untestable until the engagement is live, at which point the contract is signed and the leverage is gone.
A measured result is different. It is produced on the carrier's actual platform, with the carrier's actual transaction volumes, under live operating conditions. It is a number the CFO can scrutinise - because it is derived from data the CFO's team already holds. Insurance service expenses grew 7% year-on-year at industry level through September 2025. The CFO's appetite for an answer that survives scrutiny has never been higher.
For carriers operating under IFRS 17, there is a secondary benefit. The task-level cost data that a structured pilot produces is also the granular cost input that IFRS 17 reporting precision requires. The sandbox has value for finance beyond the BPO decision itself.
Not every pilot is a sandbox. A vendor-curated demonstration, a proof-of-concept on a sample dataset, or a trial period scoped to the easiest transactions is not the same as a structured sandbox. The difference lies in four structural requirements.
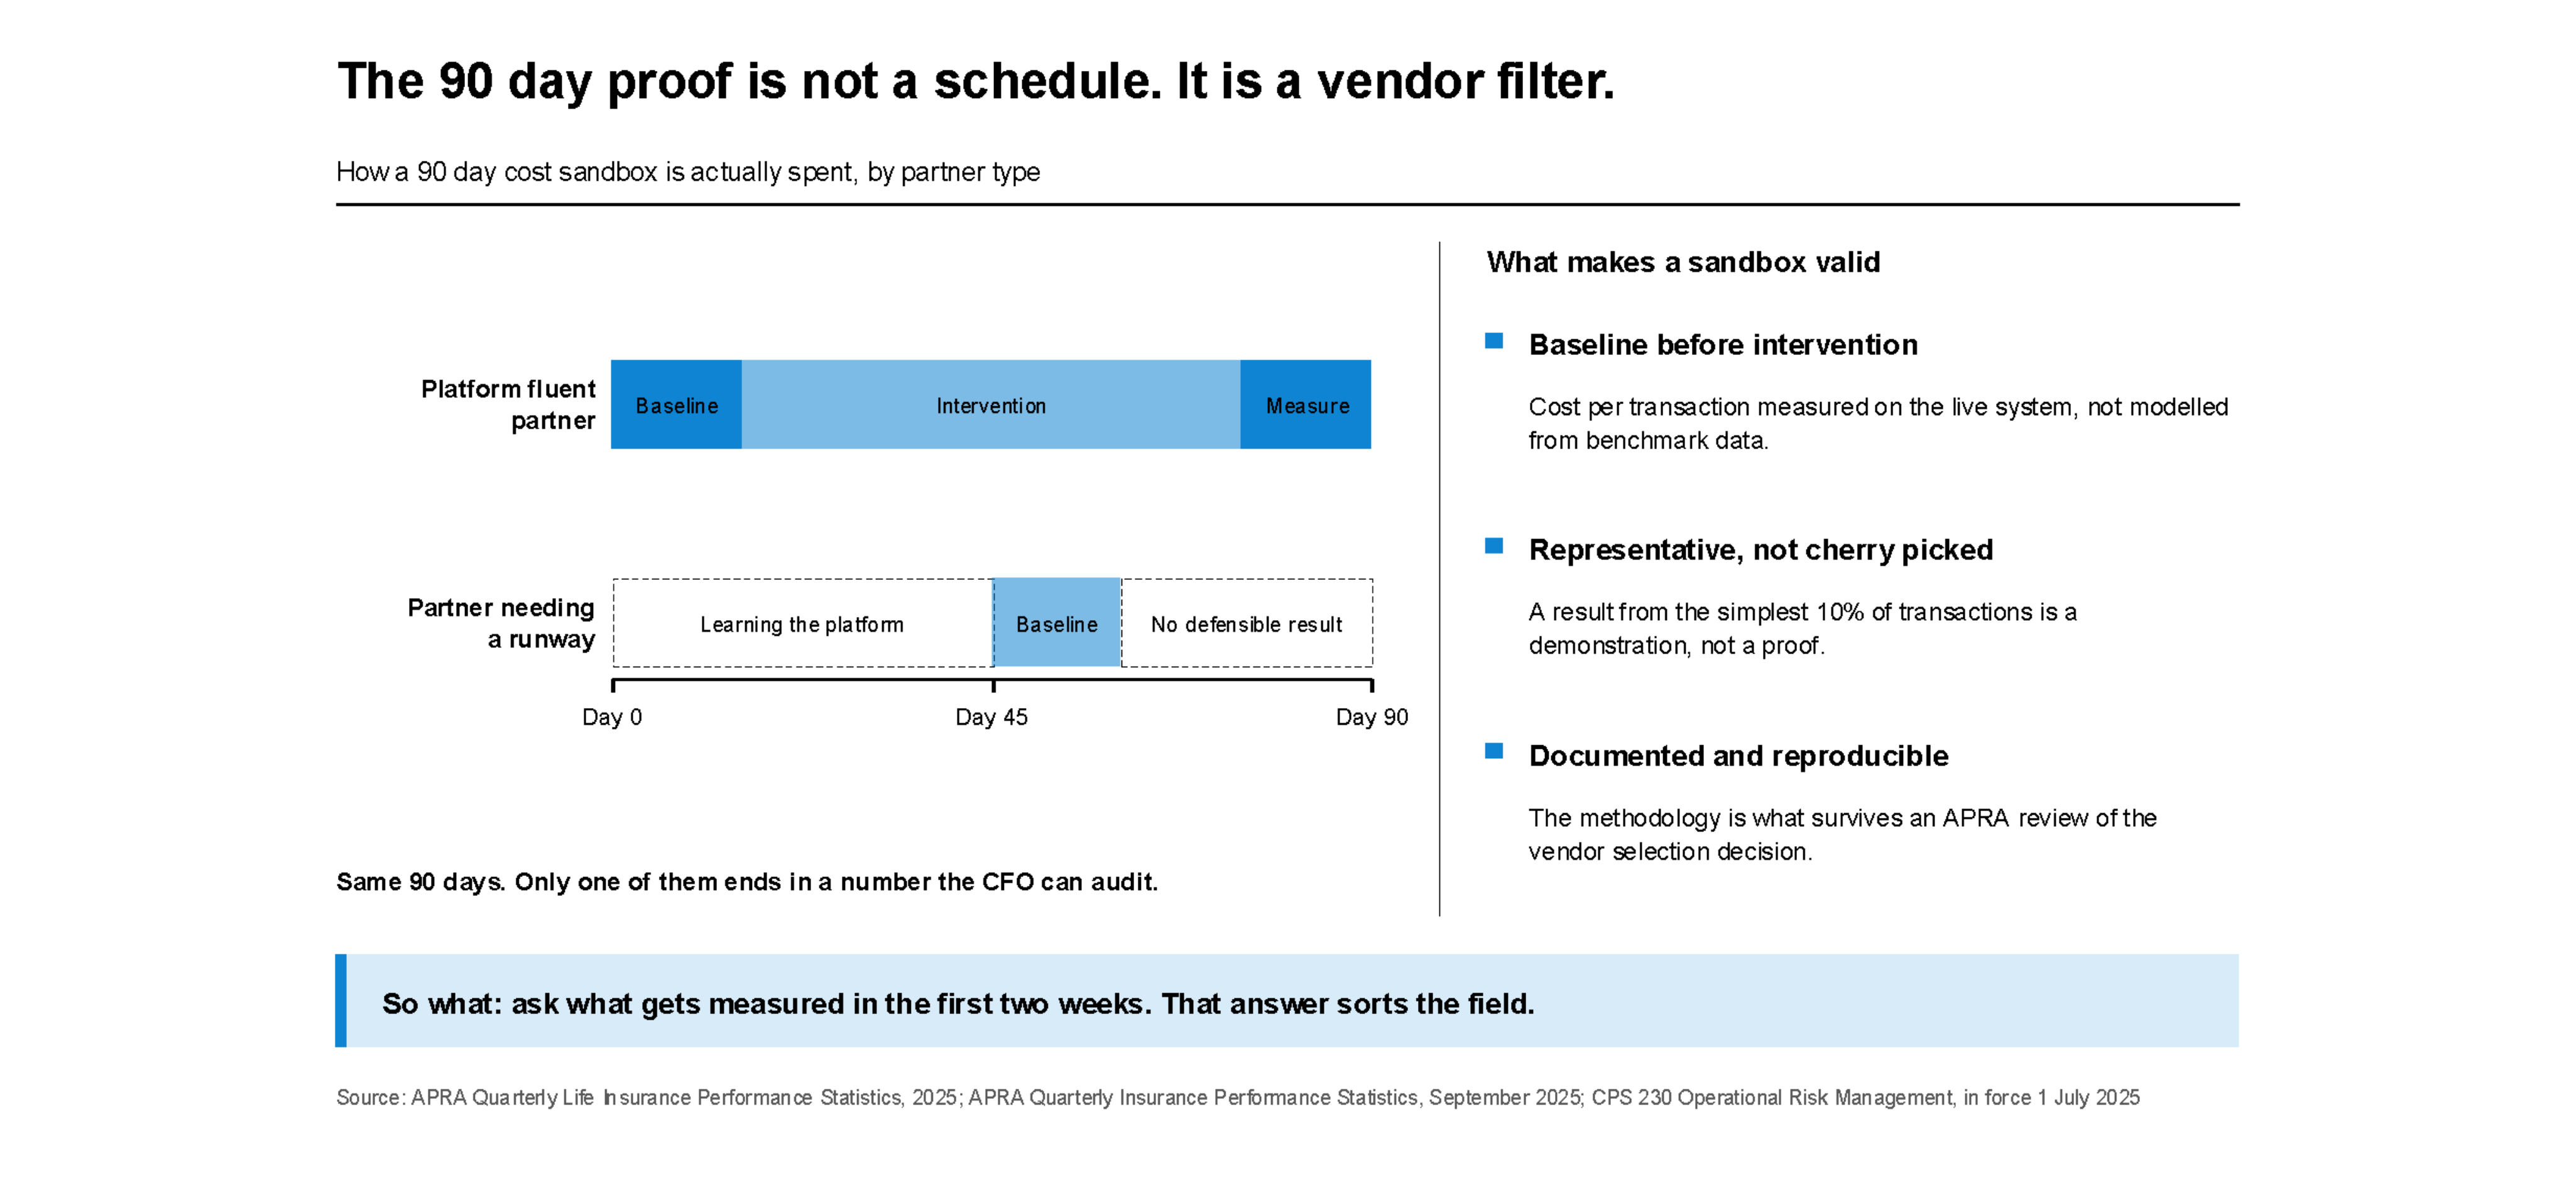
First: the baseline is measured before any intervention, on the live system. Not estimated from benchmarks, not modelled from historical data - measured. Cost-per-transaction on the actual platform, before any process change is applied.
Second: the scope is representative, not cherry-picked. The subset of transactions selected for the pilot must reflect the actual distribution of complexity across the book. A result produced on the simplest 10% of transactions is not a proof - it is a demonstration.
Third: the timeline is bounded to 90 days. This limit forces a clean result and limits the carrier's exposure to service-quality risk during the measurement phase. A scoped pilot also limits AFCA complaint exposure to a defined and recoverable window.
Fourth: the methodology is documented. The result must be reproducible at scale or it is not a proof - it is an anecdote. The documentation is also what survives an APRA audit of the vendor selection decision.
The 90-day constraint is what makes the sandbox a genuine evaluation tool. It is also what eliminates most vendors from being able to deliver one.
If the partner needs the first 45 days to learn the legacy policy administration platform - to understand the data model, map the exception-handling logic, and calibrate the QA framework - the remaining time is not enough to produce a statistically defensible baseline-and-result. The 90-day sandbox becomes a 90-day onboarding with a measurement phase to follow.
Platform fluency is the prerequisite. A partner who already operates on the carrier's system of record can begin measuring from day one. The baseline is established in the first two weeks. The intervention is applied in weeks three through ten. The result is measured and documented in the final two weeks. That is a 90-day sandbox.
The Australian BPO market is growing at 7.2% CAGR as more carriers use operational outsourcing to address cost pressure. The sandbox is the procurement methodology that makes that decision evidence-based rather than promise-based.
If your next BPO evaluation needs a result the CFO can use, the starting point is a structured sandbox on the platform you already have.
The sandbox methodology starts with measurement - on your system, from day one.
If a 90-day proof of cost reduction is the number your procurement process needs, it is worth thirty minutes to discuss what that looks like on your platform.
Sources: APRA Quarterly Life Insurance Performance Statistics (2025); APRA Quarterly Insurance Performance Statistics (September 2025); IMARC Group Australia BPO Market Report (2025)