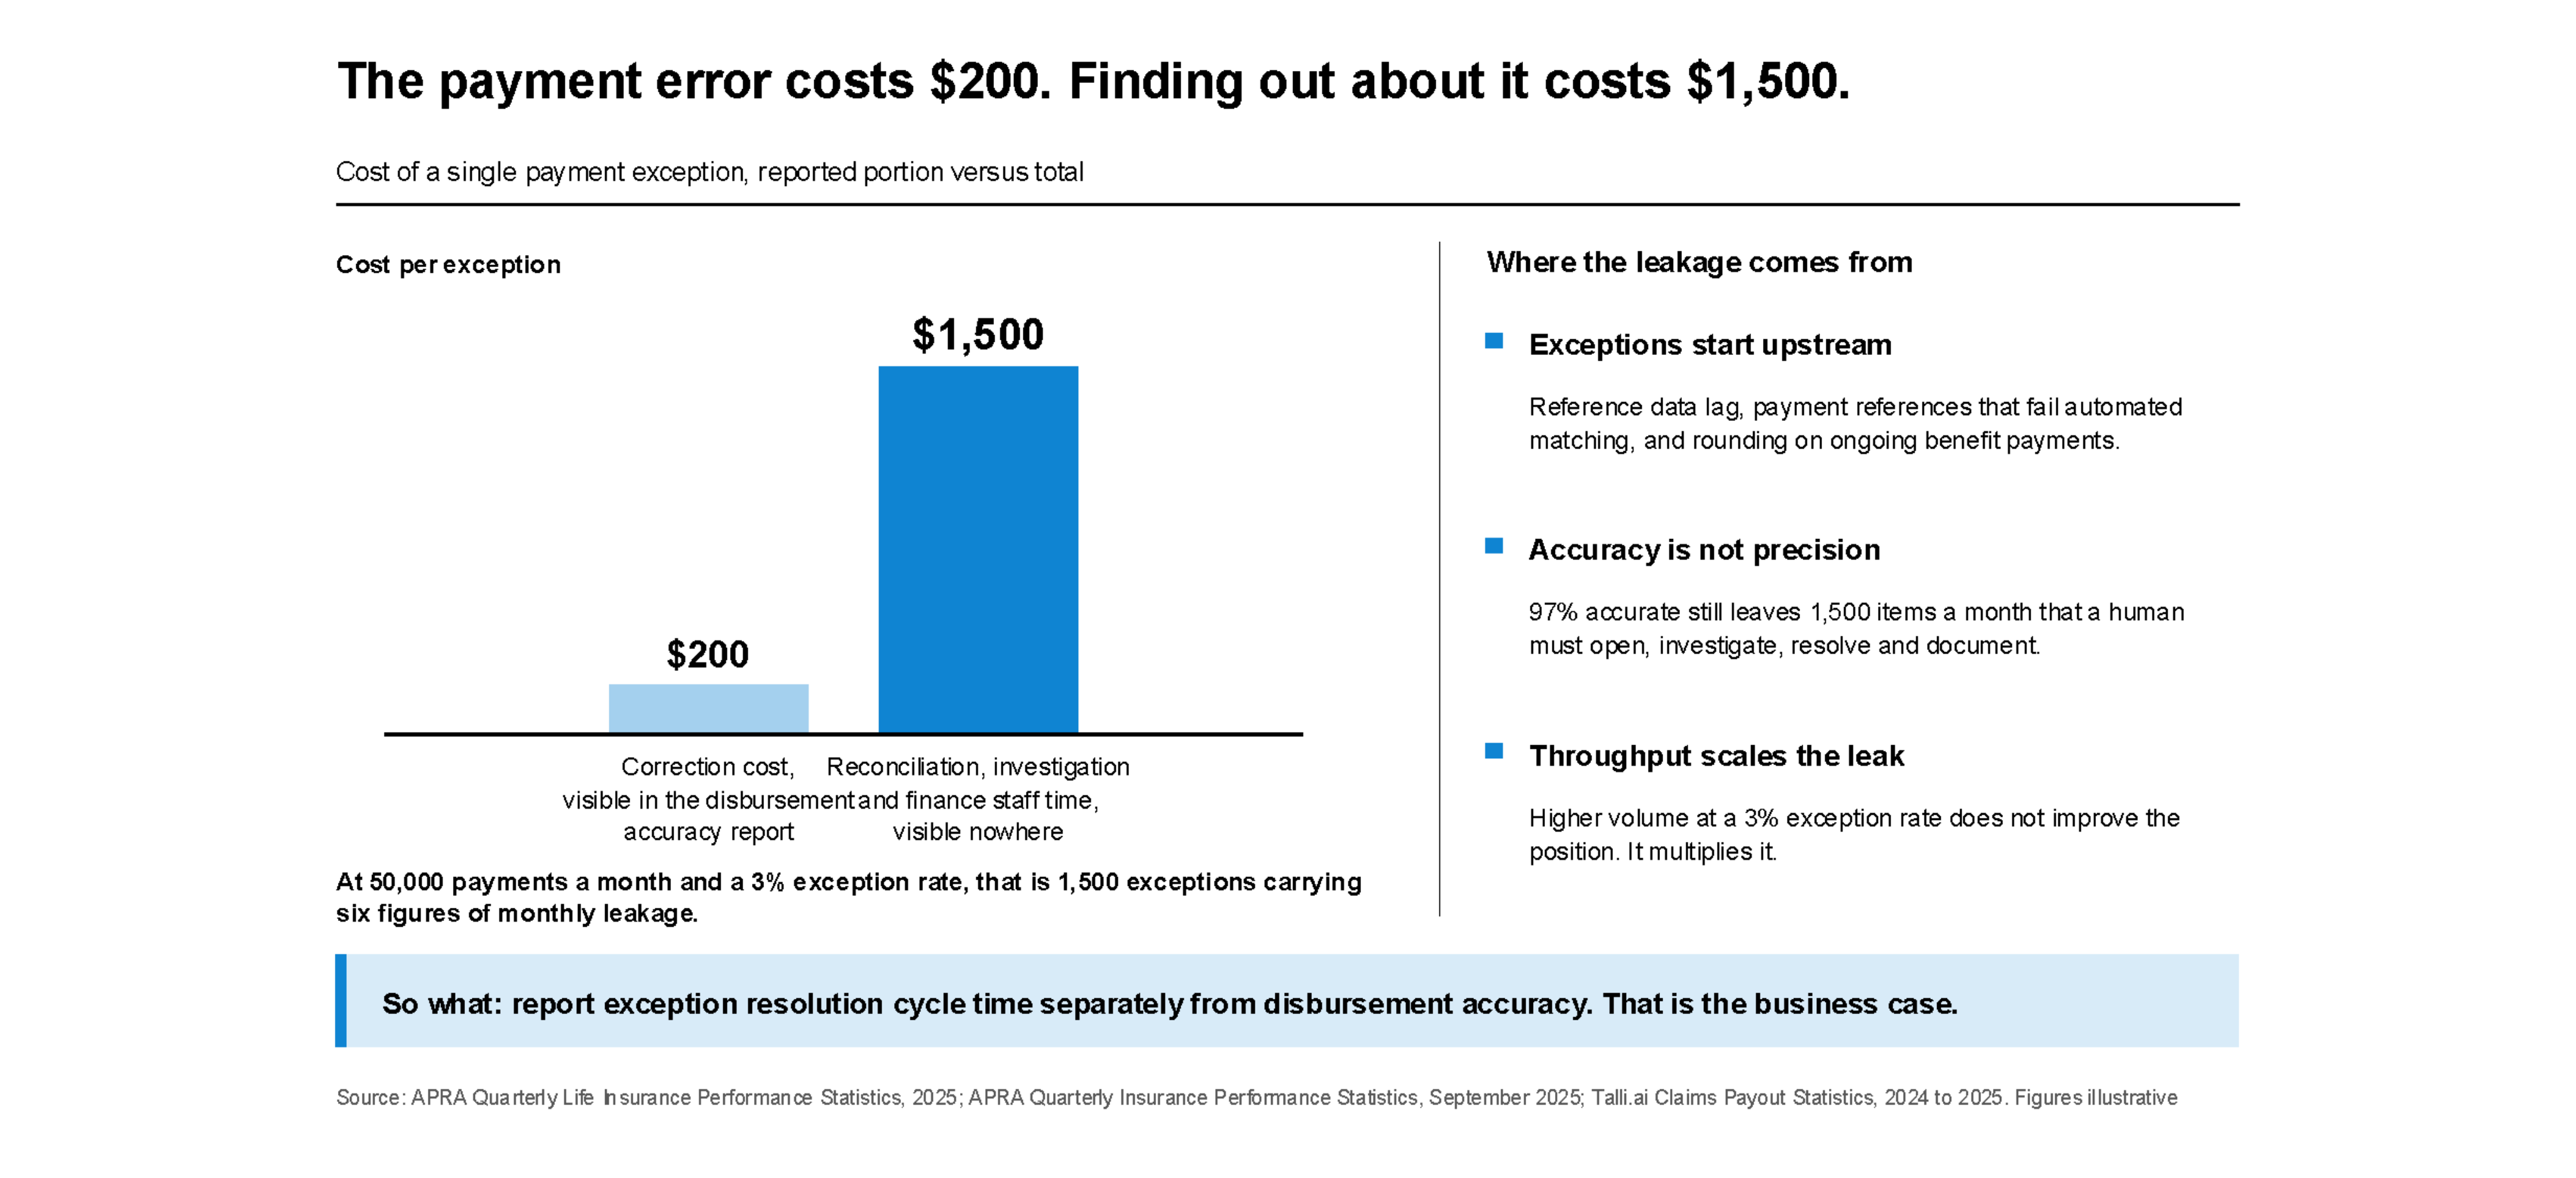


The payment error costs $200 to correct. The exception it generates costs $1,500 in reconciliation investigation, system research, and finance staff time. The $200 appears in the disbursement accuracy report. The $1,500 does not appear anywhere.
Insurance service expenses rose 7% year-on-year at industry level through September 2025. Cost reduction programs focus on headcount and automation. The cost that does not respond to those programs is in the exceptions.
At a carrier processing 50,000 claims payments per month, a 3% reconciliation exception rate generates 1,500 exceptions. At a handling cost of $50 to $150 per exception in finance staff time, system investigation, and resolution management, that is $75,000 to $225,000 in monthly leakage that does not appear in the disbursement budget. The figures are illustrative; the pattern is consistent.
The payments themselves are not the cost problem. The exceptions are.
Most payment exceptions are not caused by payment execution failure. They are caused by upstream data and process conditions.
The first driver is reference data lag. Payee account details change - beneficiary bank accounts, superannuation fund switching, employer changes in group life books that affect payment routing. When the carrier's payment system has not received the updated reference before the payment run, the payment executes against old data. It leaves the system correctly. It does not arrive where it should.
The second driver is payment instruction format. Receiving institutions - banks, superannuation funds, superannuation trustees - operate automated matching systems. A payment reference that does not conform to the expected format cannot be automatically matched. The payment arrives. Finance cannot clear it. A manual investigation begins.
The third driver is amount calculation. Rounding in ongoing income protection payments, proration errors in part-period benefits, and adjustment corrections applied inconsistently across a claim series produce amounts that diverge from the expected record by small margins. Small margins at volume are a material reconciliation problem.
The disbursement accuracy rate is 97%. The exception rate is 3%. Both describe the same operation and generate different conclusions about performance.
At 50,000 payments per month, the 3% exception rate is 1,500 items. Each requires a human to open, investigate, resolve, and document. Each defers settlement of the underlying claim. Each distorts the cost attribution record for the relevant contract group under IFRS 17.
Precision is a different measure from accuracy. An operation is precise when the proportion of payments clearing automatically - without exception handling - is maximised. That is the metric that drives the cost line.
High throughput with a 3% exception rate does not improve the leakage position. It scales it.
Three changes reduce the exception rate in a measurable way.
Reference data governance: payee records verified as current before each payment run. The update process is triggered by a policy event - beneficiary change, employer change, TPD settlement - not by a reconciliation failure after the fact.
Payment instruction format standardisation: instructions validated at the point of creation against the receiving institution's matching system specification. Rejects identified and corrected before they leave the carrier's environment, not discovered in the next reconciliation cycle.
Exception triage and routing: exceptions categorised by type on receipt and routed to the appropriate team within a defined SLA. Resolution cycle time measured and reported separately from disbursement accuracy - this produces the number the Finance controller needs to build a business case.
Under CPS 230, in force from 1 July 2025, documented exception management protocols are operational risk controls. For carriers operating under IFRS 17, reconciliation precision directly affects cost attribution accuracy for claims in the affected contract groups.
ISSI operates claims-to-payments workflows with experience in real-time claims environments. Claims-to-payments is within a single operating footprint.
If the exception queue is growing while the disbursement accuracy rate looks healthy, it is worth thirty minutes to discuss where the leakage is.
Sources: APRA Quarterly Life Insurance Performance Statistics (2025); APRA Quarterly Insurance Performance Statistics (September 2025); IMARC Group Australia BPO Market Report (2025); Talli.ai Claims Payout Statistics (2024-2025)