

The operations design question sounds simple: when something goes wrong, what happens next? Most insurance operations have an answer for the normal bad day - a volume surge, a system outage, a team member unavailable. For the bad day that takes the primary operation offline, the answer is usually more complicated than the planning assumed.
Genuine operational resilience is built around three distinct patterns. Overflow handles surge: volume above normal operating capacity arrives and the operation absorbs it without degrading quality or SLA. Failover handles disruption: the primary operation is unavailable and a second source carries the load. Handover handles planned transition: work moves deliberately between providers, with continuity maintained throughout.
Each pattern has a different activation trigger, a different test protocol, and a different definition of failure. In Australia, CPS 230, in force from 1 July 2025, requires carriers to have tested continuity arrangements for critical operations - not just documented ones. In New Zealand, equivalent obligations exist under regulatory governance requirements for licensed insurers. Tested means activated and measured. Documented means filed.
An overflow plan and a failover plan address different failure modes. A handover plan addresses a third. They require different test designs, different activation triggers, and different definitions of success.
Overflow is the most commonly tested pattern. Surge events happen. The team has handled them. The failure mode is not the straightforward surge - it is the surge that arrives simultaneously with another problem: a system access issue, a quality control pressure at peak load, a staffing gap that compounds the volume pressure.
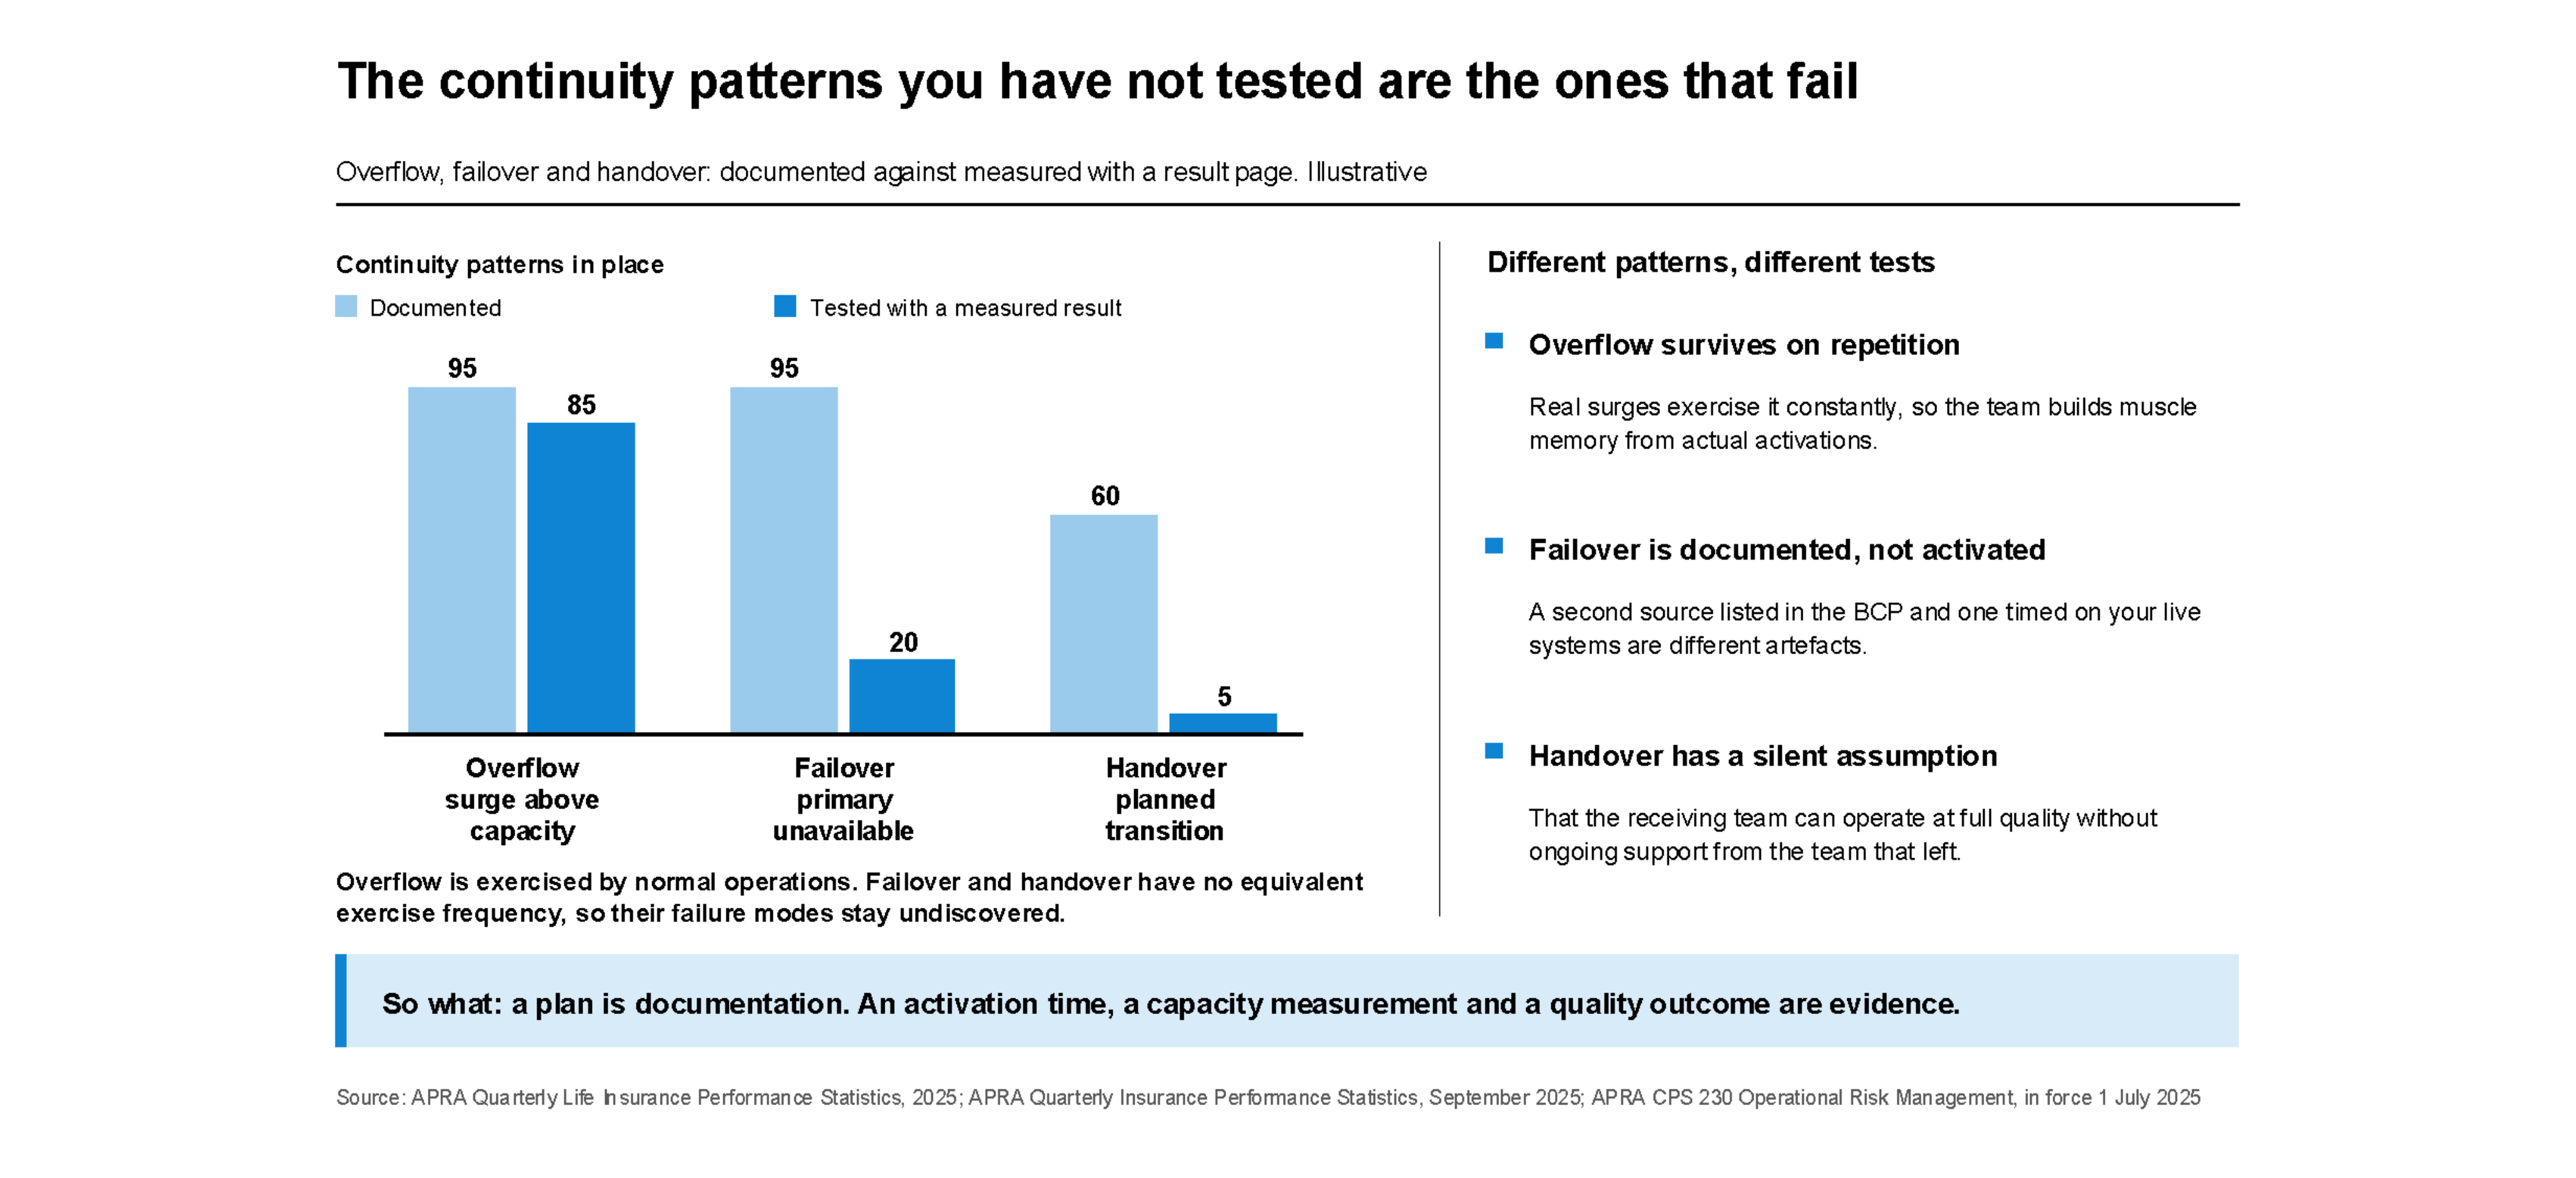
Failover is the most commonly documented but least commonly tested pattern. A second source listed in the BCP and a second source that has been activated and timed on the carrier's actual systems are different things. The second source that needs weeks of training before it can process a claim is not a failover arrangement. It is a deferred response that arrives too late.
Handover is rarely tested in any meaningful way. The failure mode is specific: the receiving provider cannot operate at full quality without ongoing support from the originating team. This support is frequently not in the plan - it is a silent assumption that becomes visible only when the contract ends and the gap appears.
The patterns you have not tested are the ones that fail when you need them.
Overflow survives because normal operations exercise it repeatedly. The team's muscle memory for surge is built from real activations. Failover and handover do not have the same exercise frequency. A failover arrangement that has never been activated and measured against the carrier's live systems has not been validated. A handover plan that has never been executed and assessed for knowledge transfer quality has not been proven.
The distinction that CPS 230 examinations and New Zealand regulatory governance reviews are increasingly drawing is between documentation and evidence. A plan is documentation. A test result with an activation time, a capacity measurement, and a quality outcome is evidence. The two are different artefacts. Only one satisfies the tested standard.
Each pattern requires a distinct test design.
For overflow: simulate a volume surge without advance notice to the operational team. Measure the actual time to full capacity deployment and the quality outcome at peak load. The results page documents activation time and quality - not the plan's estimated figures, the measured ones.
For failover: activate the second source with real system access and measure the actual time to full operational capacity from the point of activation. The critical measurement is day-one performance - not week-two performance after onboarding has settled. If the second source cannot carry load on day one, the documented RTO is aspirational.
For handover: complete a real planned transition and then assess the receiving provider's first period of fully independent operation. The measure is quality without support from the originating team. If the receiving team is calling back for system guidance after handover, the knowledge transfer is incomplete.
The plan that has results pages for all three patterns is the one that can be shown to a board or a regulator as evidence of tested operational resilience. The plan without results pages contains undiscovered failure modes.
ISSI operates as a warm second source on the platforms ANZ carriers already run. Because platform fluency on CyberLife, wmA, and Ingenium already exists, there is no ramp period before failover load can be carried. The same platform knowledge that enables immediate failover also enables handover quality - the receiving team does not need to call back for system guidance. If overflow, failover, or handover design is active in your resilience programme, it is worth thirty minutes.
Sources: APRA Quarterly Life Insurance Performance Statistics (2025); APRA Quarterly Insurance Performance Statistics (September 2025)