

The board asks for margin by product line. Your team pulls the numbers. The answer shifts depending on how shared servicing costs were allocated - and no one formally agreed on those allocation rules when the portfolio was assembled. The board gets an answer. Whether it is the right answer is another question.
IFRS 17 has been in force across Australia and New Zealand since January 2023. It requires carriers to measure and report profitability at the product-group level. That requirement did not change how most internal cost models work. Operations teams still receive a blended figure - a single cost-per-policy or cost-per-transaction that flattens life, general, and specialty into one number. When the board asks which line is generating margin and which is consuming it, the internal model cannot give a clean answer. That gap is becoming harder to defend.
Each insurance line has a distinct cost profile. Life servicing is characterised by long policy durations, infrequent but complex transactions - surrenders, benefit variations, lapse management - and high manual handling per case. General insurance runs at high transaction volume with shorter cycle times and more standardised processing. Specialty sits at the other end: low volume, high complexity, exception-heavy servicing that resists automation.
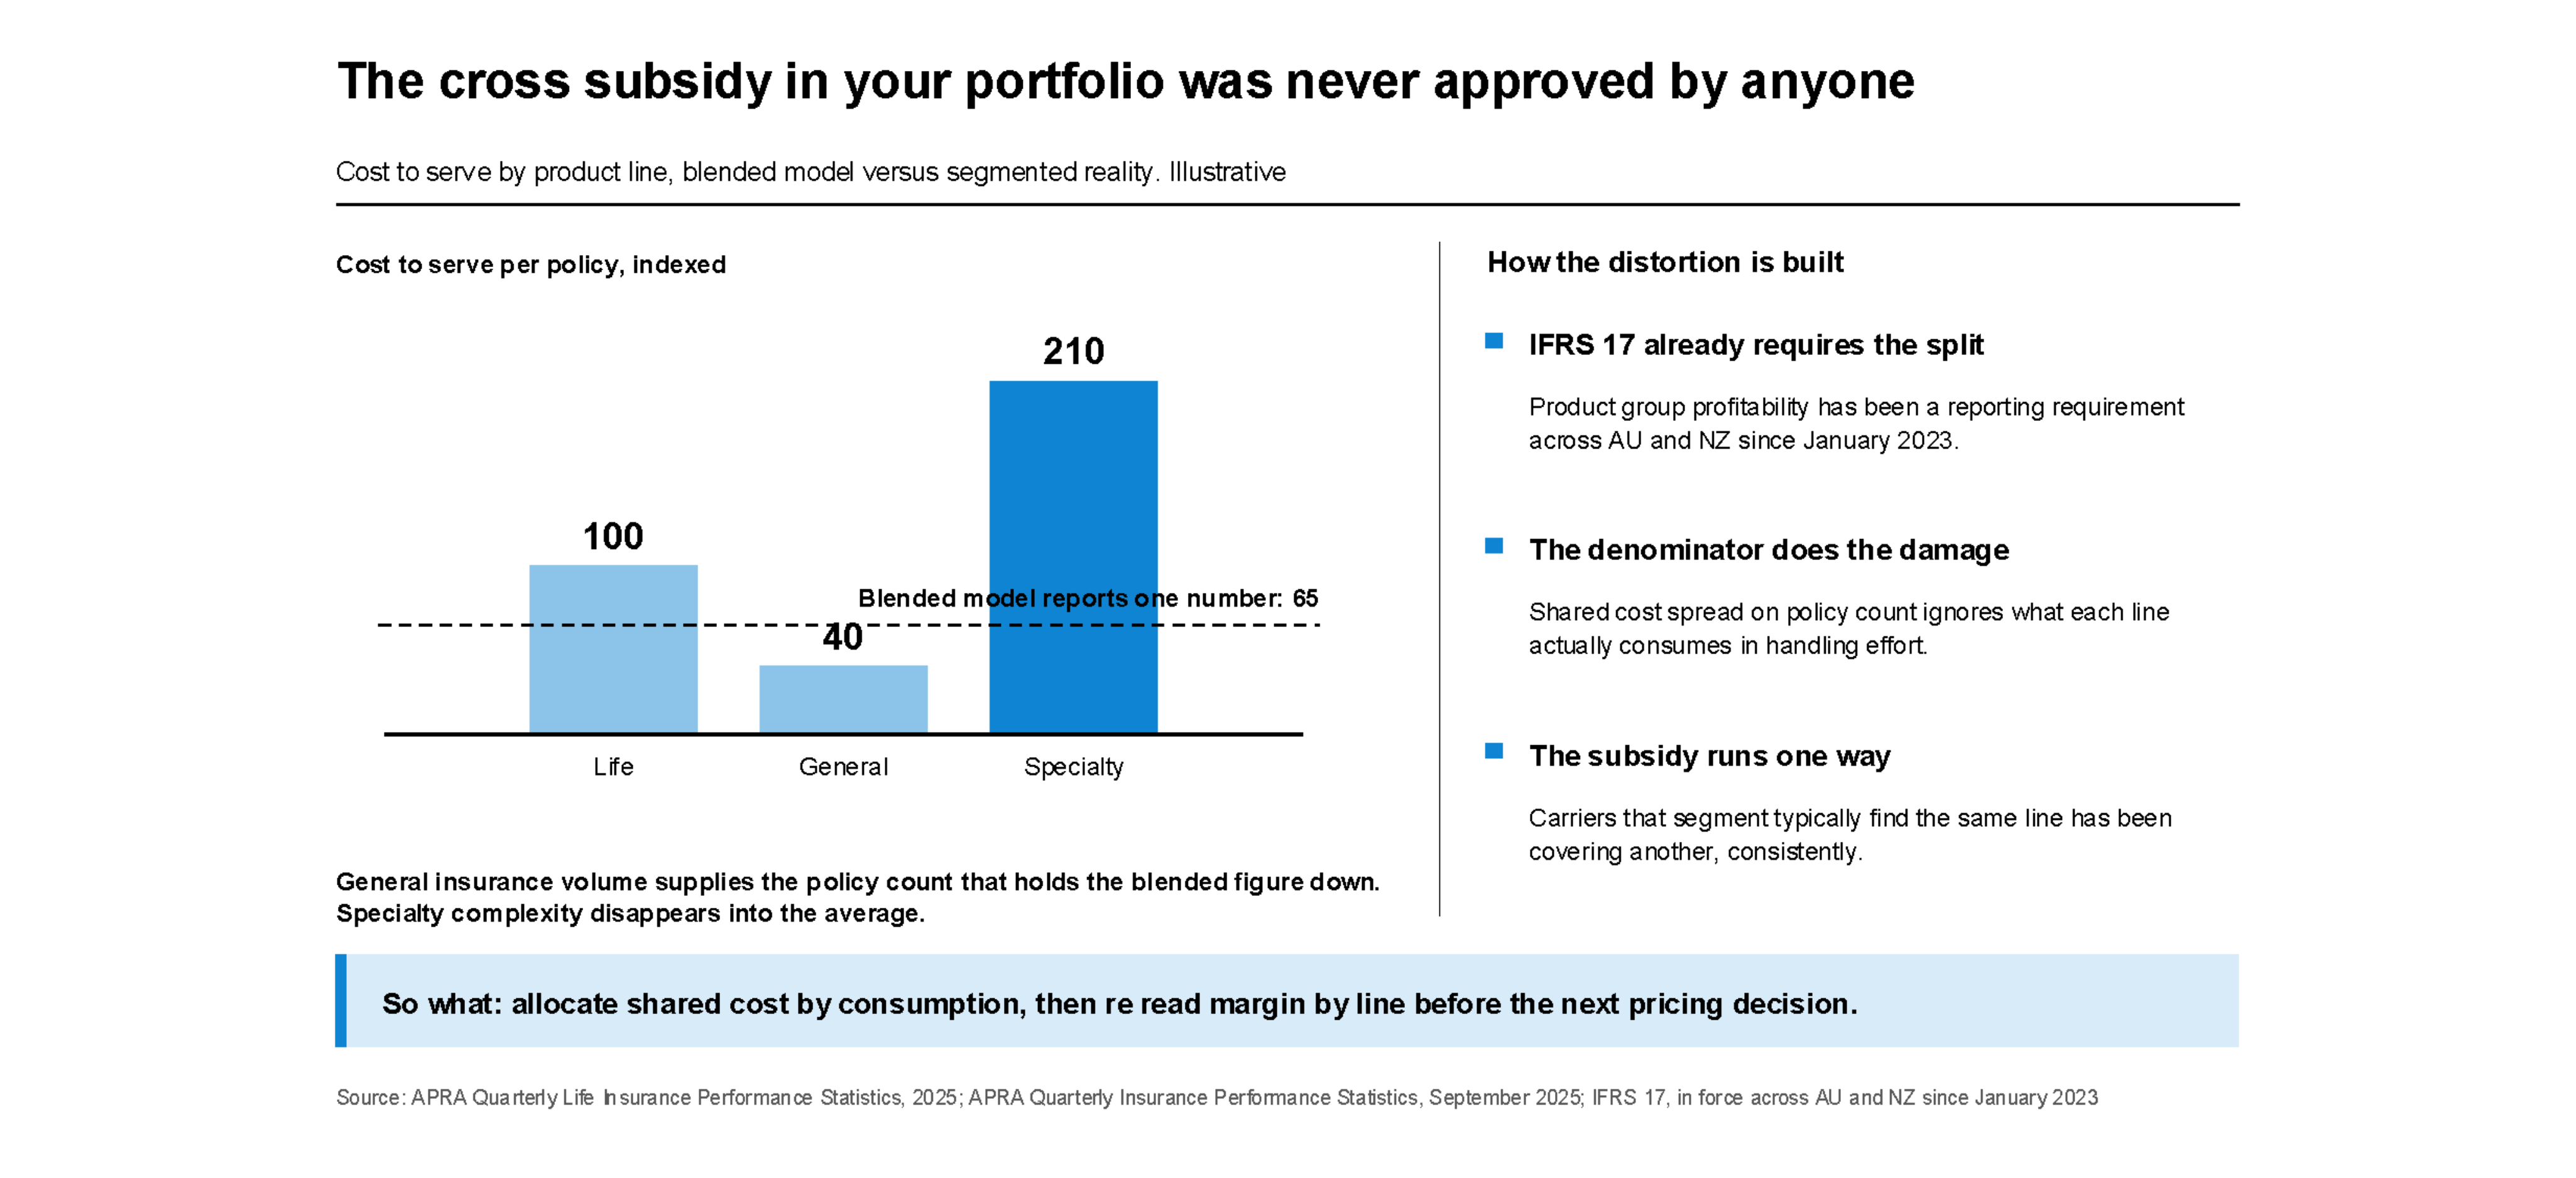
A blended cost model pools all three. Shared costs are spread using a simple denominator - typically transaction count or policy count - regardless of the actual work each line demands. A blended cost model cannot tell you which line is driving cost, and neither can the person who built it - because it was never designed to.
The model was a rational simplification when portfolios had one dominant line. At mixed-portfolio scale, it becomes a structural distortion.
The practical consequence is cross-subsidy. When life servicing carries a higher cost-per-transaction than general, but shared costs are allocated on a per-policy basis, the relative economics of each line are misrepresented. General insurance - with its high transaction volume - generates the count that keeps the blended per-unit figure low. Life appears to bear overhead proportionately when it does not. Specialty, with very low policy counts, can look artificially affordable when its complexity is averaged against high-volume general lines.
Carriers that have moved to segmented cost reporting typically find the cross-subsidy runs in one direction consistently. One line has been covering another. The strategic decisions sitting on top of that distortion - pricing, resourcing, portfolio investment - were built against a number that did not reflect the true economics.
The subsidy was never approved. It is a modelling artefact from the way the portfolio was assembled.
Separating cost-to-serve by product line requires four things.
First, a cost driver analysis by line. Life servicing cost is driven by case complexity and manual intervention rate. General insurance cost tracks transaction volume and claims handling speed. Specialty cost tracks exception handling frequency and escalation rate. These are different metrics and require different measurement approaches.
Second, a shared cost allocation methodology that reflects actual consumption - not headcount or policy count as a blunt proxy. Activity-based costing at the operational level gives a more defensible allocation.
Third, line-level process baselines. Process mining against existing platform data can surface what the actual work looks like in each line, without a manual time-and-motion study.
Fourth, reporting architecture that separates the lines. IFRS 17 created the external requirement; the internal model needs to match it.
Insurance service expenses across the Australian market rose 7% year on year to September 2025, according to APRA. Carriers that cannot attribute that rise to a specific line cannot manage it.
Across mixed portfolios, the cost differences between life, general, and specialty lines are visible at the platform level - where transaction types, handling steps, and exception rates are recorded separately. If segmenting cost-to-serve by product line is a live challenge in your organisation, it is worth thirty minutes to discuss what platform-level cost analysis could show.
Sources: APRA Quarterly Insurance Performance Statistics (September 2025); APRA Quarterly Life Insurance Performance Statistics (2025); IFRS 17 - International Financial Reporting Standard 17, in force Australia and New Zealand since January 2023