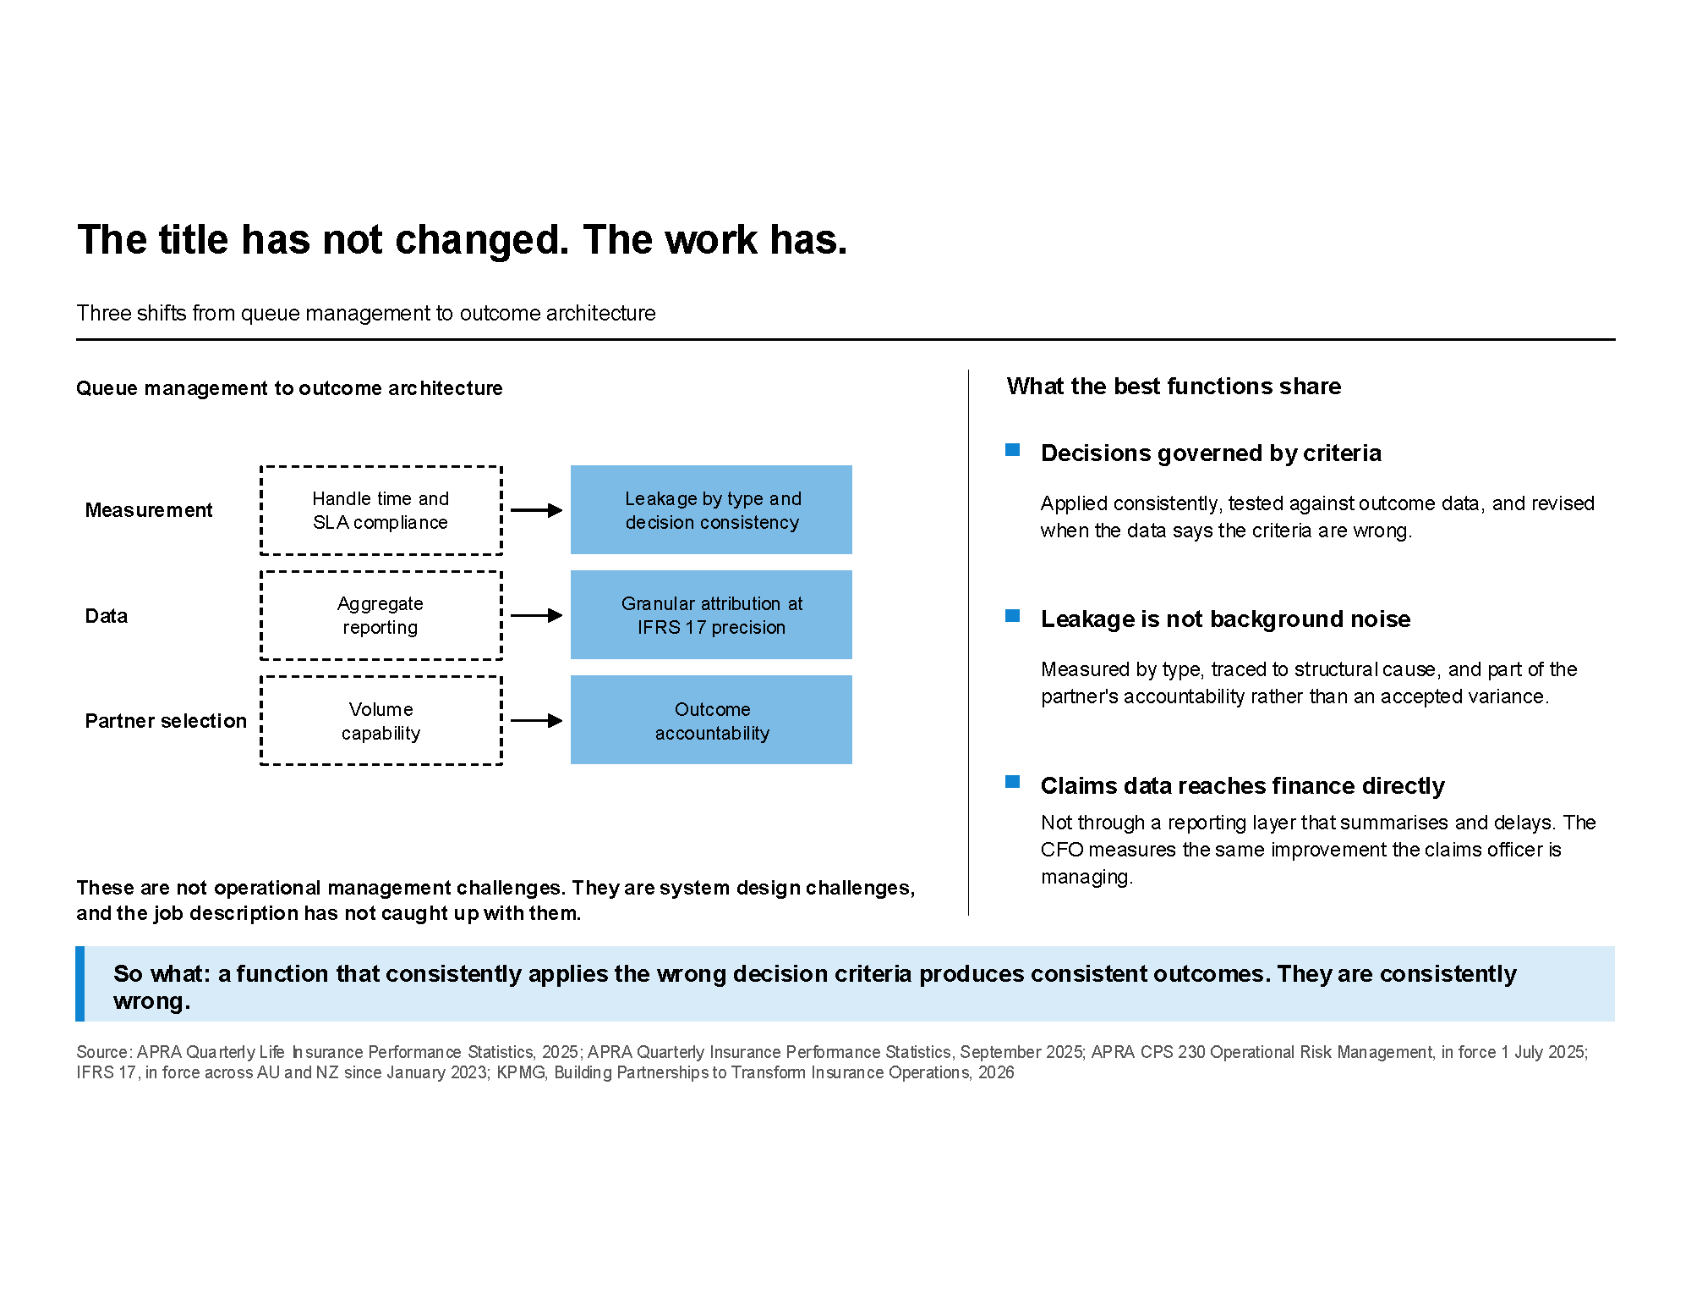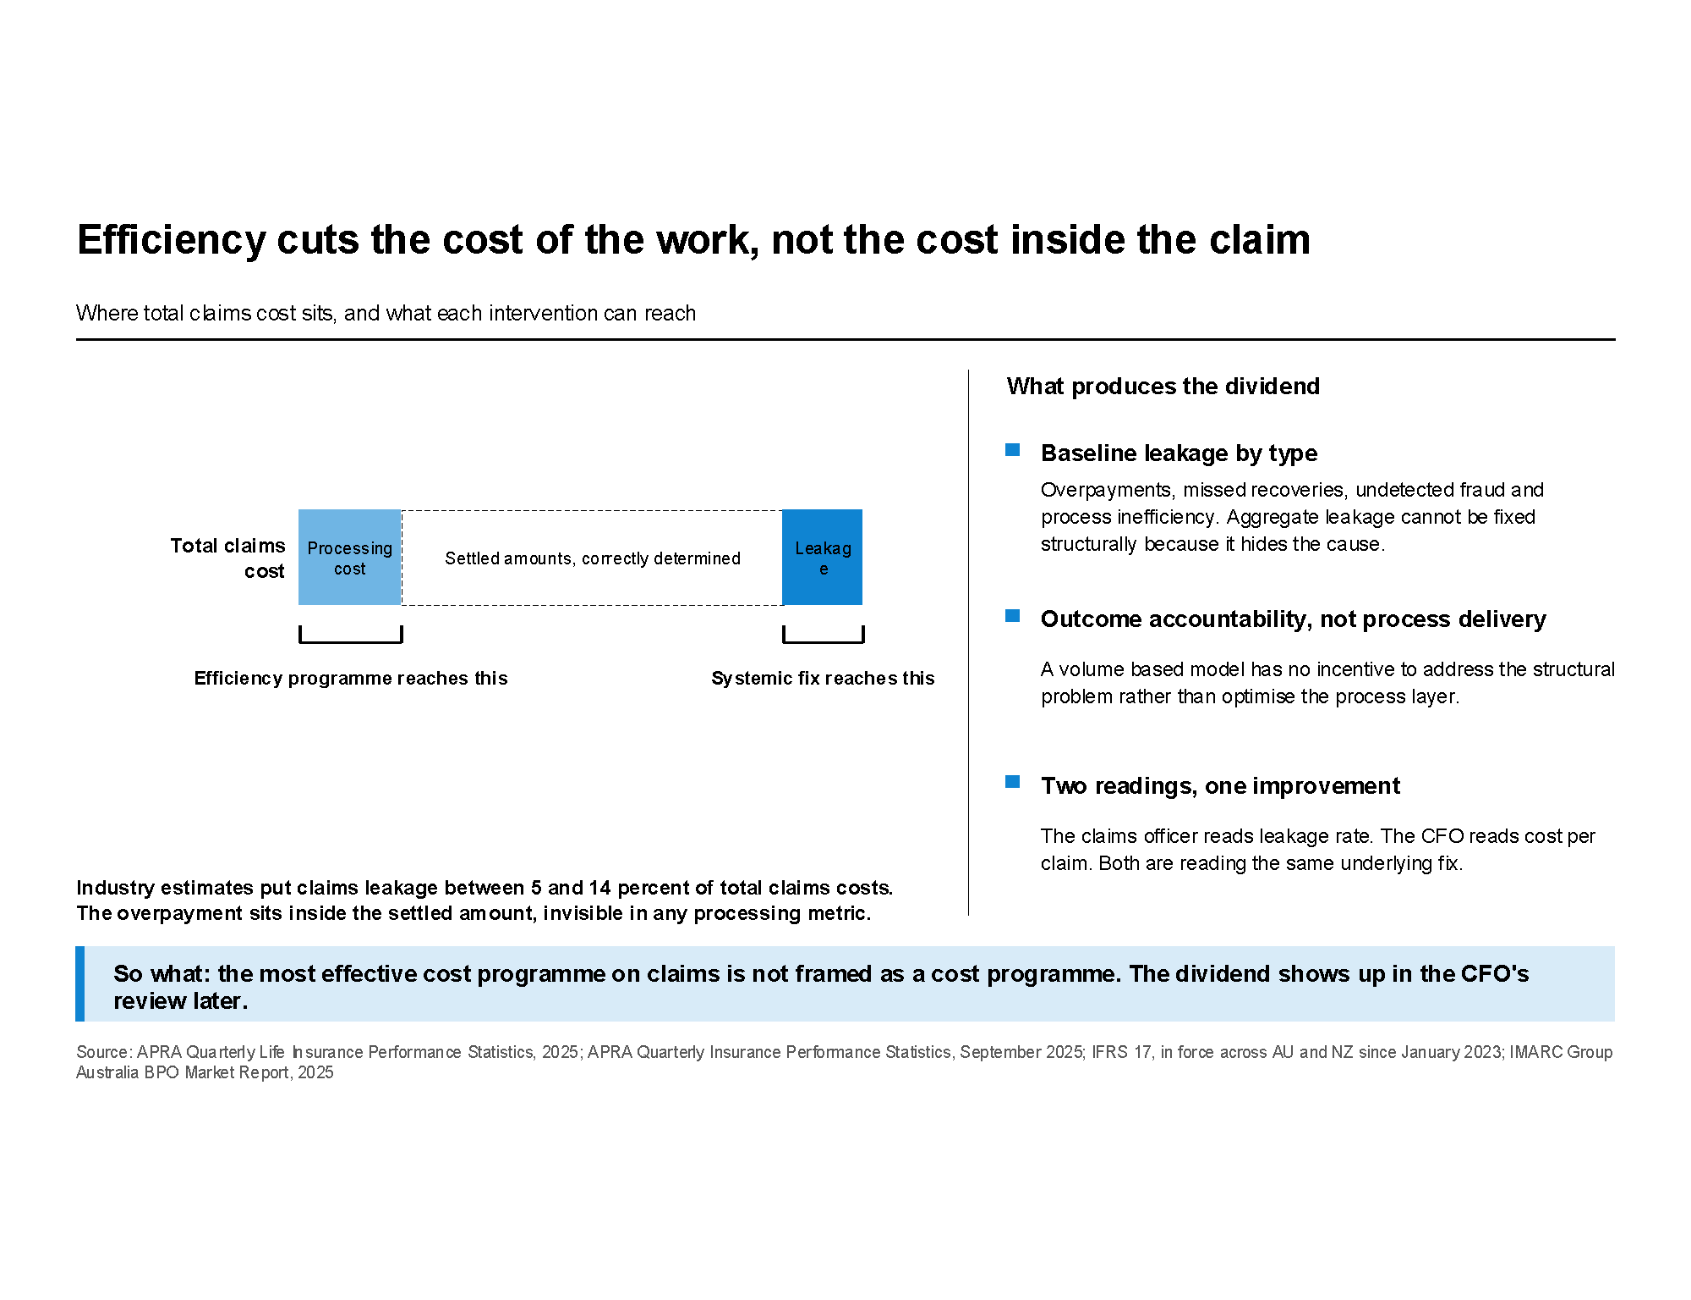


The most expensive automation projects in insurance operations are not the ones that failed to deploy. They are the ones that deployed successfully - on the wrong tasks. A functional RPA workflow applied to a judgment-required process does not reduce cost. It defers the error to a point where it is three times more expensive to fix.
The cost pressure driving automation investment is real. Insurance service expenses rose 7% year-on-year across Australia to September 2025.
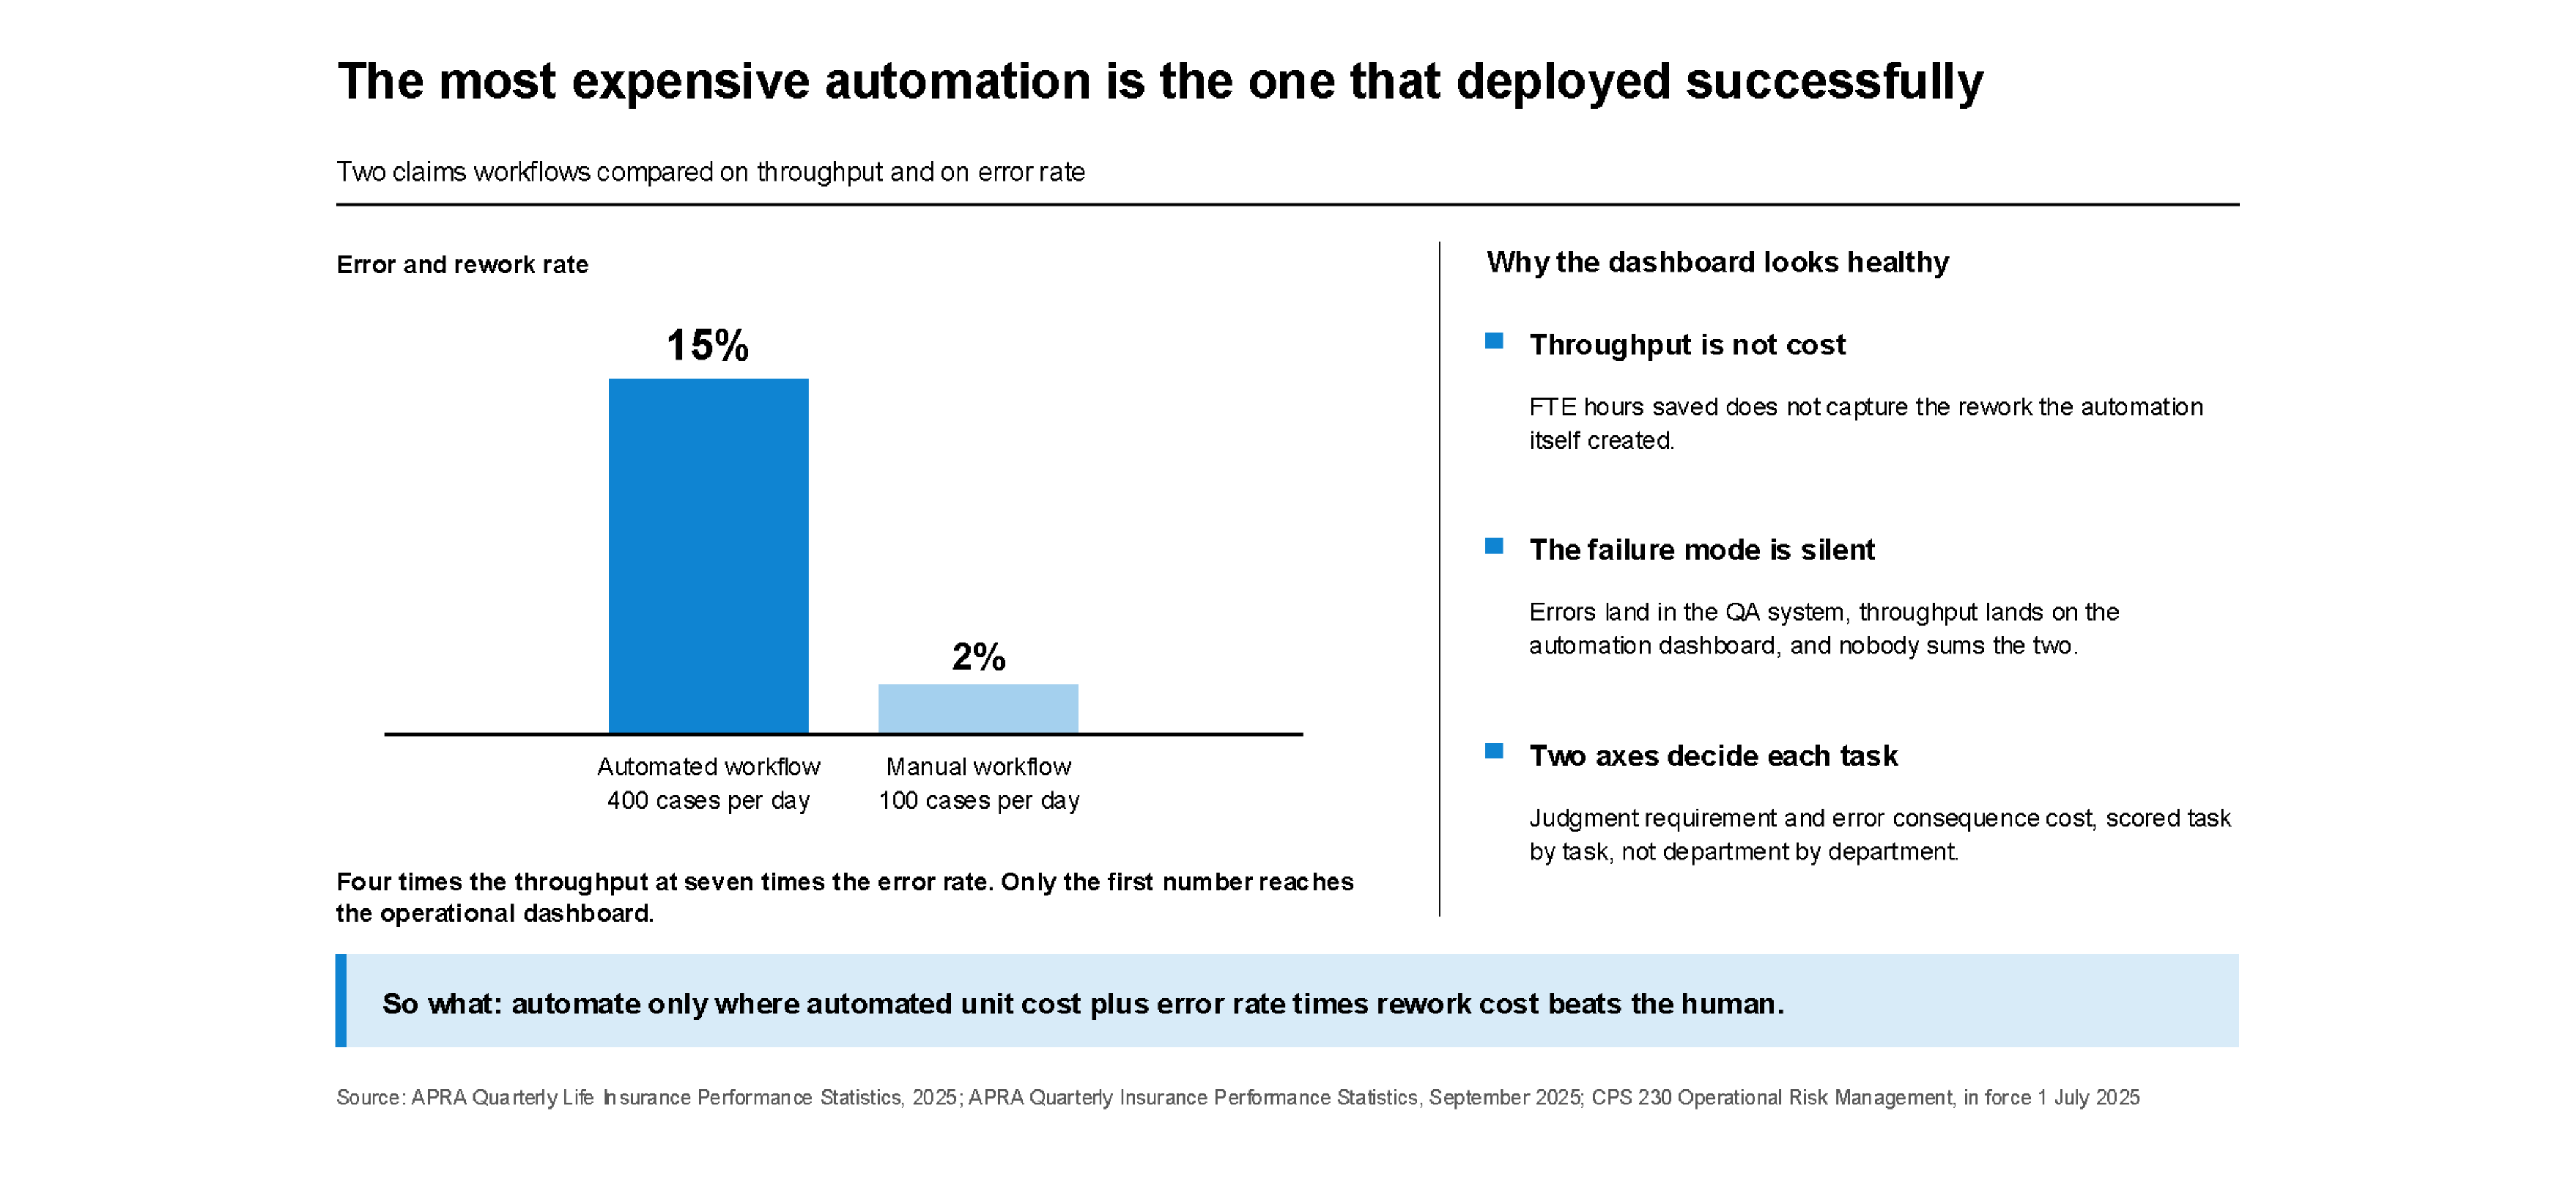
The problem is the measurement. Standard automation ROI tracks throughput and FTE-equivalent hours saved. Neither metric captures the rework cost that accumulates when automation processes the wrong case types. Speed is not the same as cost reduction. A workflow processing four hundred cases per day with a 15% error rate produces a higher unit cost after rework than a manual process handling one hundred cases per day with a 2% rework rate.
The most expensive failure pattern is also the least visible. The automation processes volume. The error is in the output, not the operational dashboard. The exception queue grows with cases the automation cannot handle - or cases it handled incorrectly and returned.
The automation is working. It is working on the wrong tasks.
The rework report lives in the QA team's system. Throughput metrics live in the automation dashboard. No one has calculated the combined cost per transaction. That gap is where unit cost rises while throughput metrics look healthy.
In claims operations, the highest-risk task types involve unstructured or ambiguous evidence: complex medical documentation where automated extraction errors are common; ongoing income protection claims requiring a fresh incapacity assessment the workflow routes without triggering one; policy tracing where employer-change records create a branching decision the automation resolves by defaulting to one path.
The alternative to "automate what you can" is a task-by-task decision built on two axes.
The first axis is judgment requirement: how much contextual assessment does this task require before an accurate output is produced? Low-judgment tasks include document routing by claim type, status notifications, and data entry from structured forms. High-judgment tasks include TPD assessment, ongoing incapacity review, and escalation decisions on ambiguous documentation.
The second axis is error consequence cost: if this task produces an error, what does it cost to identify and correct it? Low-consequence tasks are quickly caught. High-consequence tasks generate rework, delays, complaint risk, or regulatory exposure.
The combination produces the automation decision per task. Low judgment and low error consequence: automate. High judgment and high error consequence: skilled human. The mixed quadrants require a QA gate, not a binary answer.
The cost formula is: unit cost (automated) + (error rate x rework cost per error) versus unit cost (human). Where the first number is lower, automation is right. Where it is not, deploying a skilled assessor is the cost model working correctly - not a failure of the automation program.
The calculation is straightforward once the task map exists.
For each task type: record human handling time and loaded hourly rate to establish the current unit cost. Project the automated unit cost: tool cost per transaction plus oversight cost. Estimate the error rate under automation and the average cost to identify and correct each error. Multiply error rate by rework cost by daily volume; add to the automated unit cost.
Where automation plus rework is lower than human cost: automate, with a QA gate calibrated to the error consequence level. Where it is higher: skilled assessors. Their cost is now justified by the model, not by instinct.
Under CPS 230, in force from 1 July 2025, documented governance of automated processes in critical operations is a compliance requirement. A task-level cost model recording what is automated, what is not, and why is also that documentation.
The cost model starts with task-level mapping on the live system.
If automation has improved throughput in your operation but unit cost has not moved, it is worth thirty minutes to discuss what the task-level cost model shows.
Sources: APRA Quarterly Life Insurance Performance Statistics (2025); APRA Quarterly Insurance Performance Statistics (September 2025); IMARC Group Australia BPO Market Report (2025)